
Executive brief
An employee completes work faster with AI. What should the business do next?
The answer depends on what changed across the whole workflow, whether the result remained acceptable, and how the organization can use the released capacity. A shorter task can support lower costs, more output, better service, improved quality or a more sustainable workload. Each requires different evidence and a different management response.
The central distinction is between capacity released and benefit realized. Time multiplied by a salary rate can describe the labor value of capacity under stated assumptions. It does not establish that expenditure fell, output increased or profit improved.
This report recommends three requirements before scaling an initiative on the strength of productivity claims:
- Measure the accepted outcome. Include preparation, review, correction and exceptions, as well as the work AI accelerates.
- Name the route to value. Specify what will happen to the released capacity and who can make that happen.
- Verify the business result. Compare costs and outcomes with a credible alternative over a period relevant to the work.
The decision is not simply whether employees save time. It is whether the proposed deployment produces enough of the intended benefit, within quality and operating constraints, to justify its next investment.
What the public evidence establishes
Primary research provides evidence of real gains in some settings, slower work in another, and time savings that do not automatically reshape other activity. These findings concern different workers, tools and tasks. They should inform what to measure rather than become a universal productivity assumption.
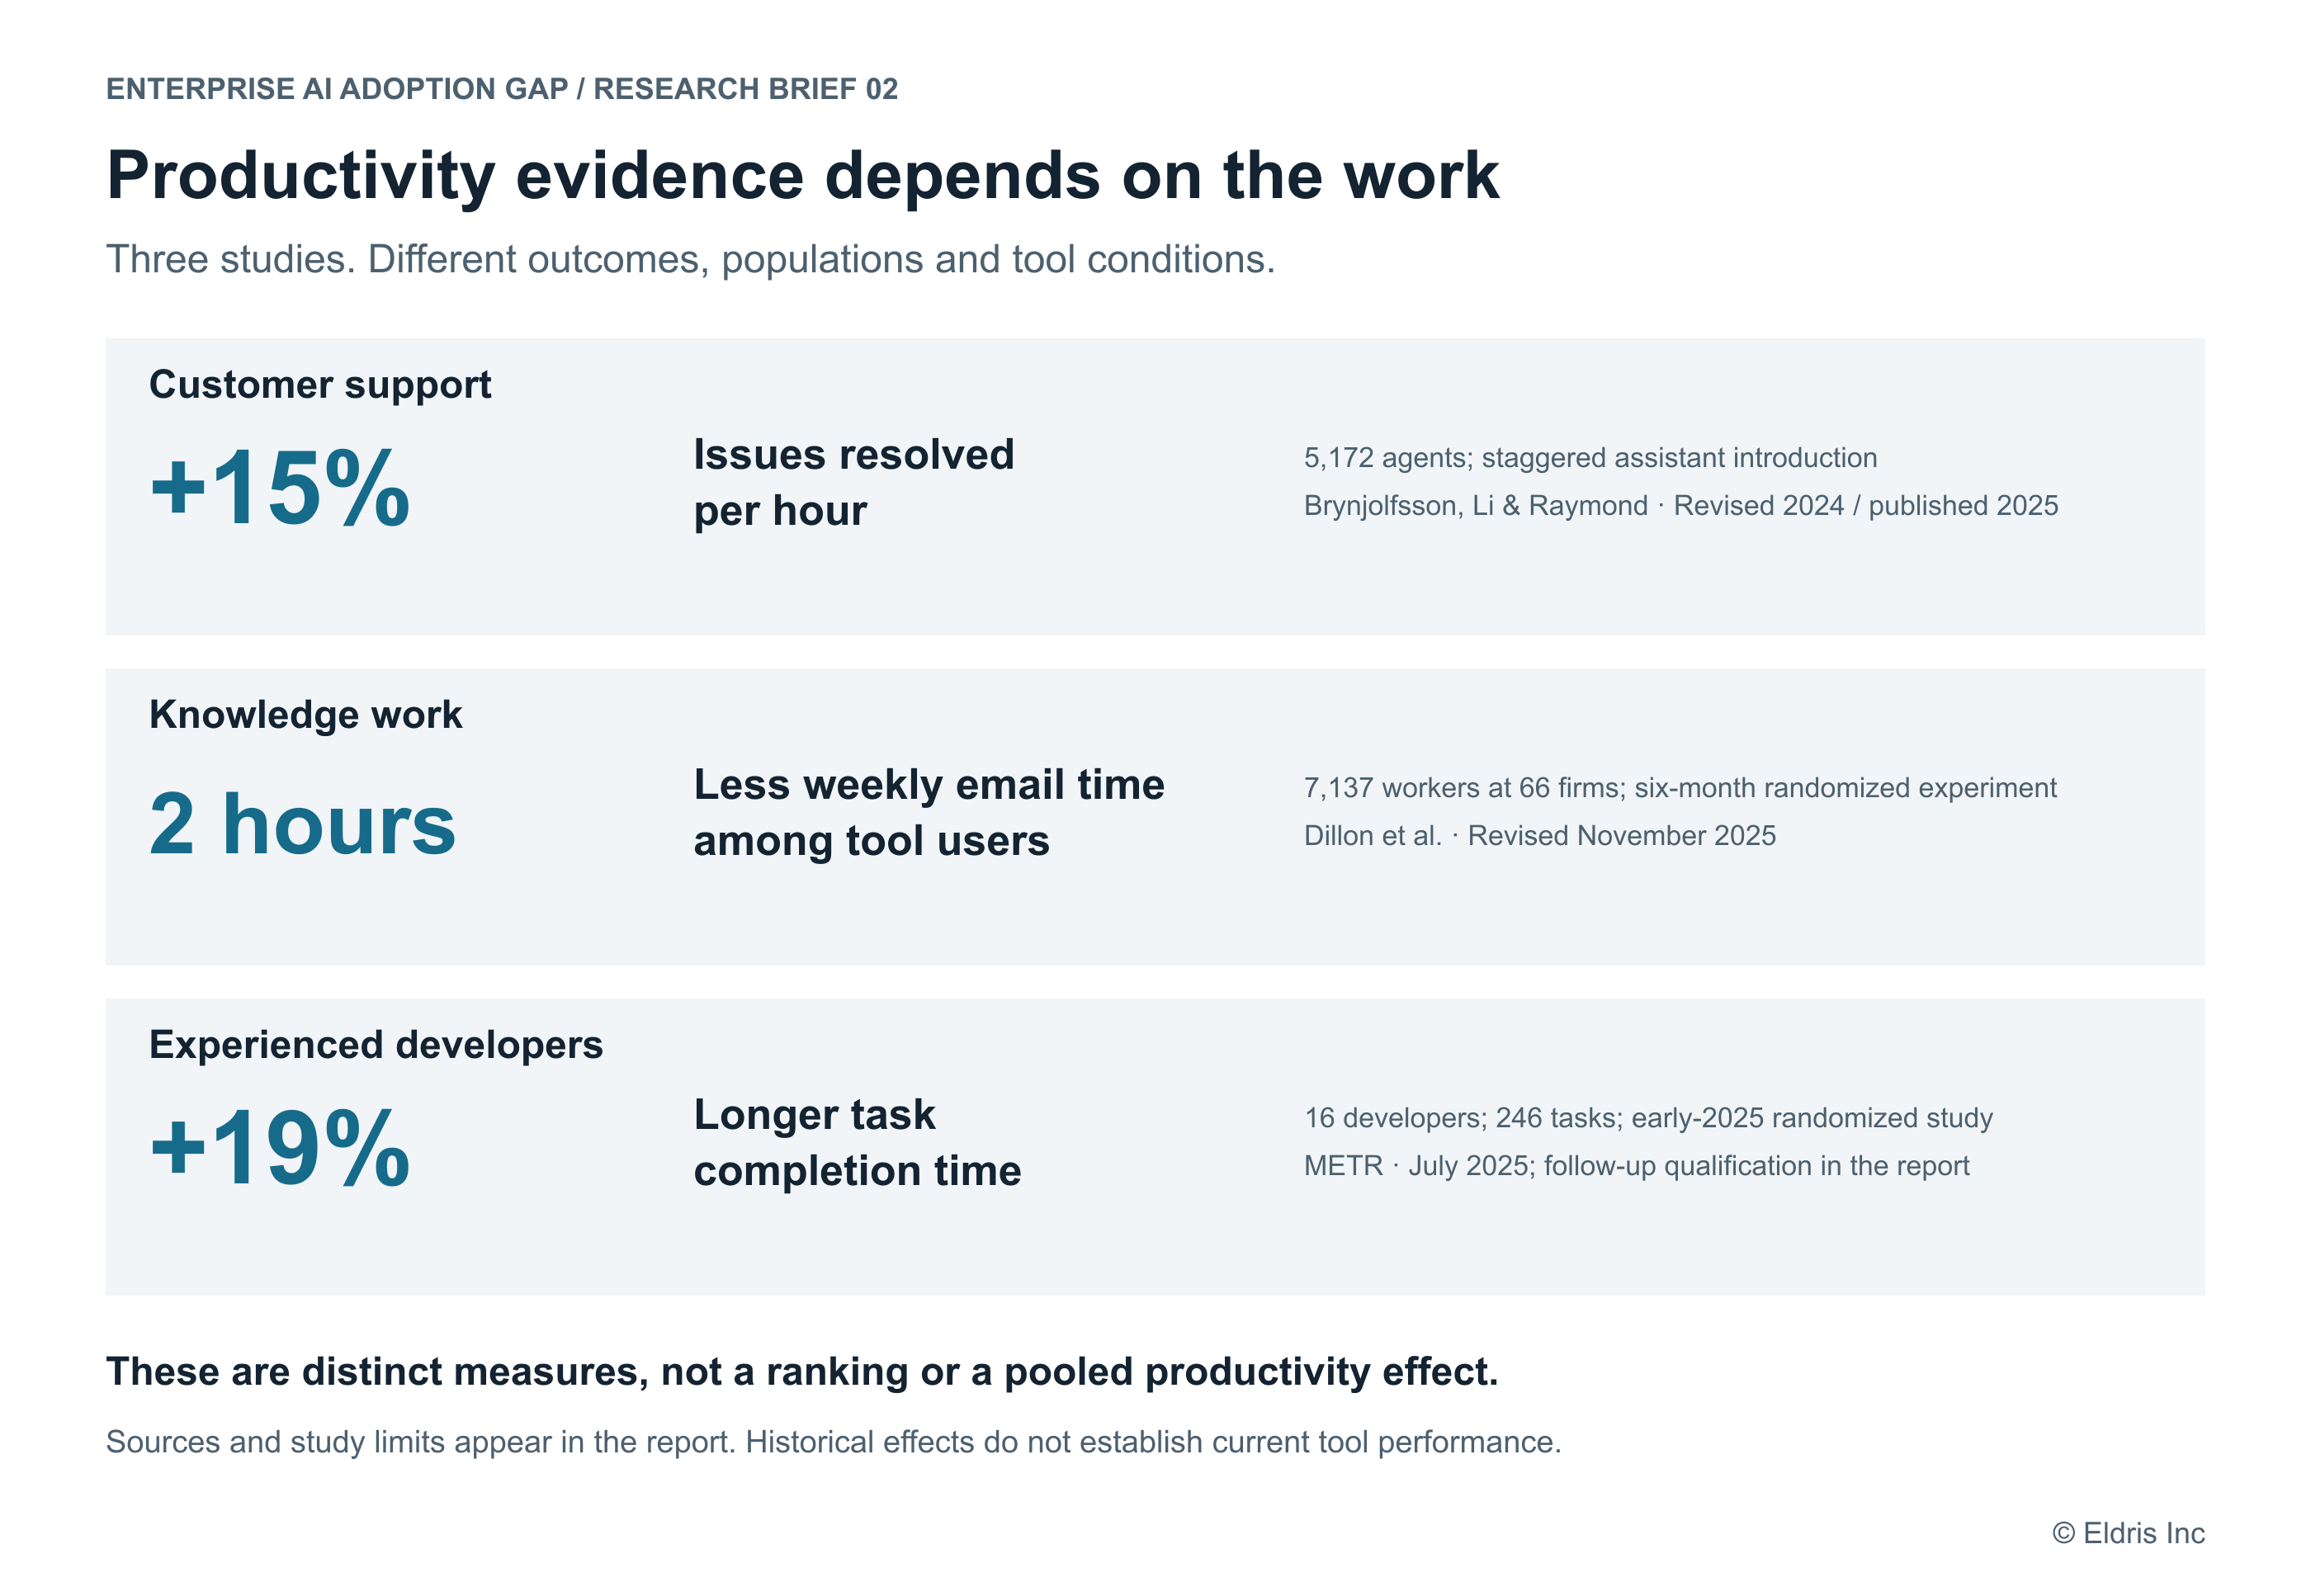
Figure 1. Productivity evidence depends on the work being measured. These source snapshots retain their units and study populations. No common effect size or pooled estimate is implied. The developer result is historical; the follow-up qualification below is essential to interpreting it.
Customer support: a measured operational improvement. Brynjolfsson, Li and Raymond studied the staggered introduction of an assistant among 5,172 customer-support agents. The revised paper reports a 15% average increase in issues resolved per hour, with gains varying by worker experience and skill. This measures an operational output, rather than just reported time saved. It does not establish a 15% reduction in labor spending or a 15% increase in enterprise profit. Revised research paper.
Knowledge work: a change in time allocation. Dillon and colleagues report a six-month randomized field experiment across 66 firms and 7,137 knowledge workers. In its second half, the 80% of treated workers who used the tool spent two fewer hours on email each week. The authors did not detect changes in task quantity or composition from individual access. This supports distinguishing a time-use improvement from wider operational change; failure to detect a change does not prove no benefit existed. NBER paper, revised November 2025.
Software development: perceptions can diverge from measured performance. METR's early-2025 randomized study covered 16 experienced open-source developers and 246 tasks in familiar repositories. AI access increased completion time by 19%, while participants subsequently estimated that it had made them 20% faster. This is a bounded historical result, not a claim about all developers or current tools. METR study.
The update matters. In February 2026, METR reported that its later experiment gave an unreliable signal of the current effect, citing participation and task selection, changed compensation, and difficulties measuring concurrent agent work. The authors considered greater acceleration plausible but warned against treating their data as a reliable estimate of its size. We therefore do not use the earlier slowdown as a current market benchmark. METR follow-up.
Management implication: External studies establish possibilities and measurement problems. Test the task, worker population and operating conditions relevant to your proposed deployment.
Measure the work through acceptance
AI may shorten drafting while increasing the effort needed to check facts, reconcile outputs or resolve exceptions. A deployment should therefore be measured through the point at which the result is accepted for its intended use.
For a document workflow, that point might be approval for delivery. For customer support, it might be a correctly resolved case, with subsequent reopening tracked. For software, it might be an accepted change with appropriate testing and a defined follow-up period for defects.
The boundary matters. Finishing a draft is not the same as finishing the work.
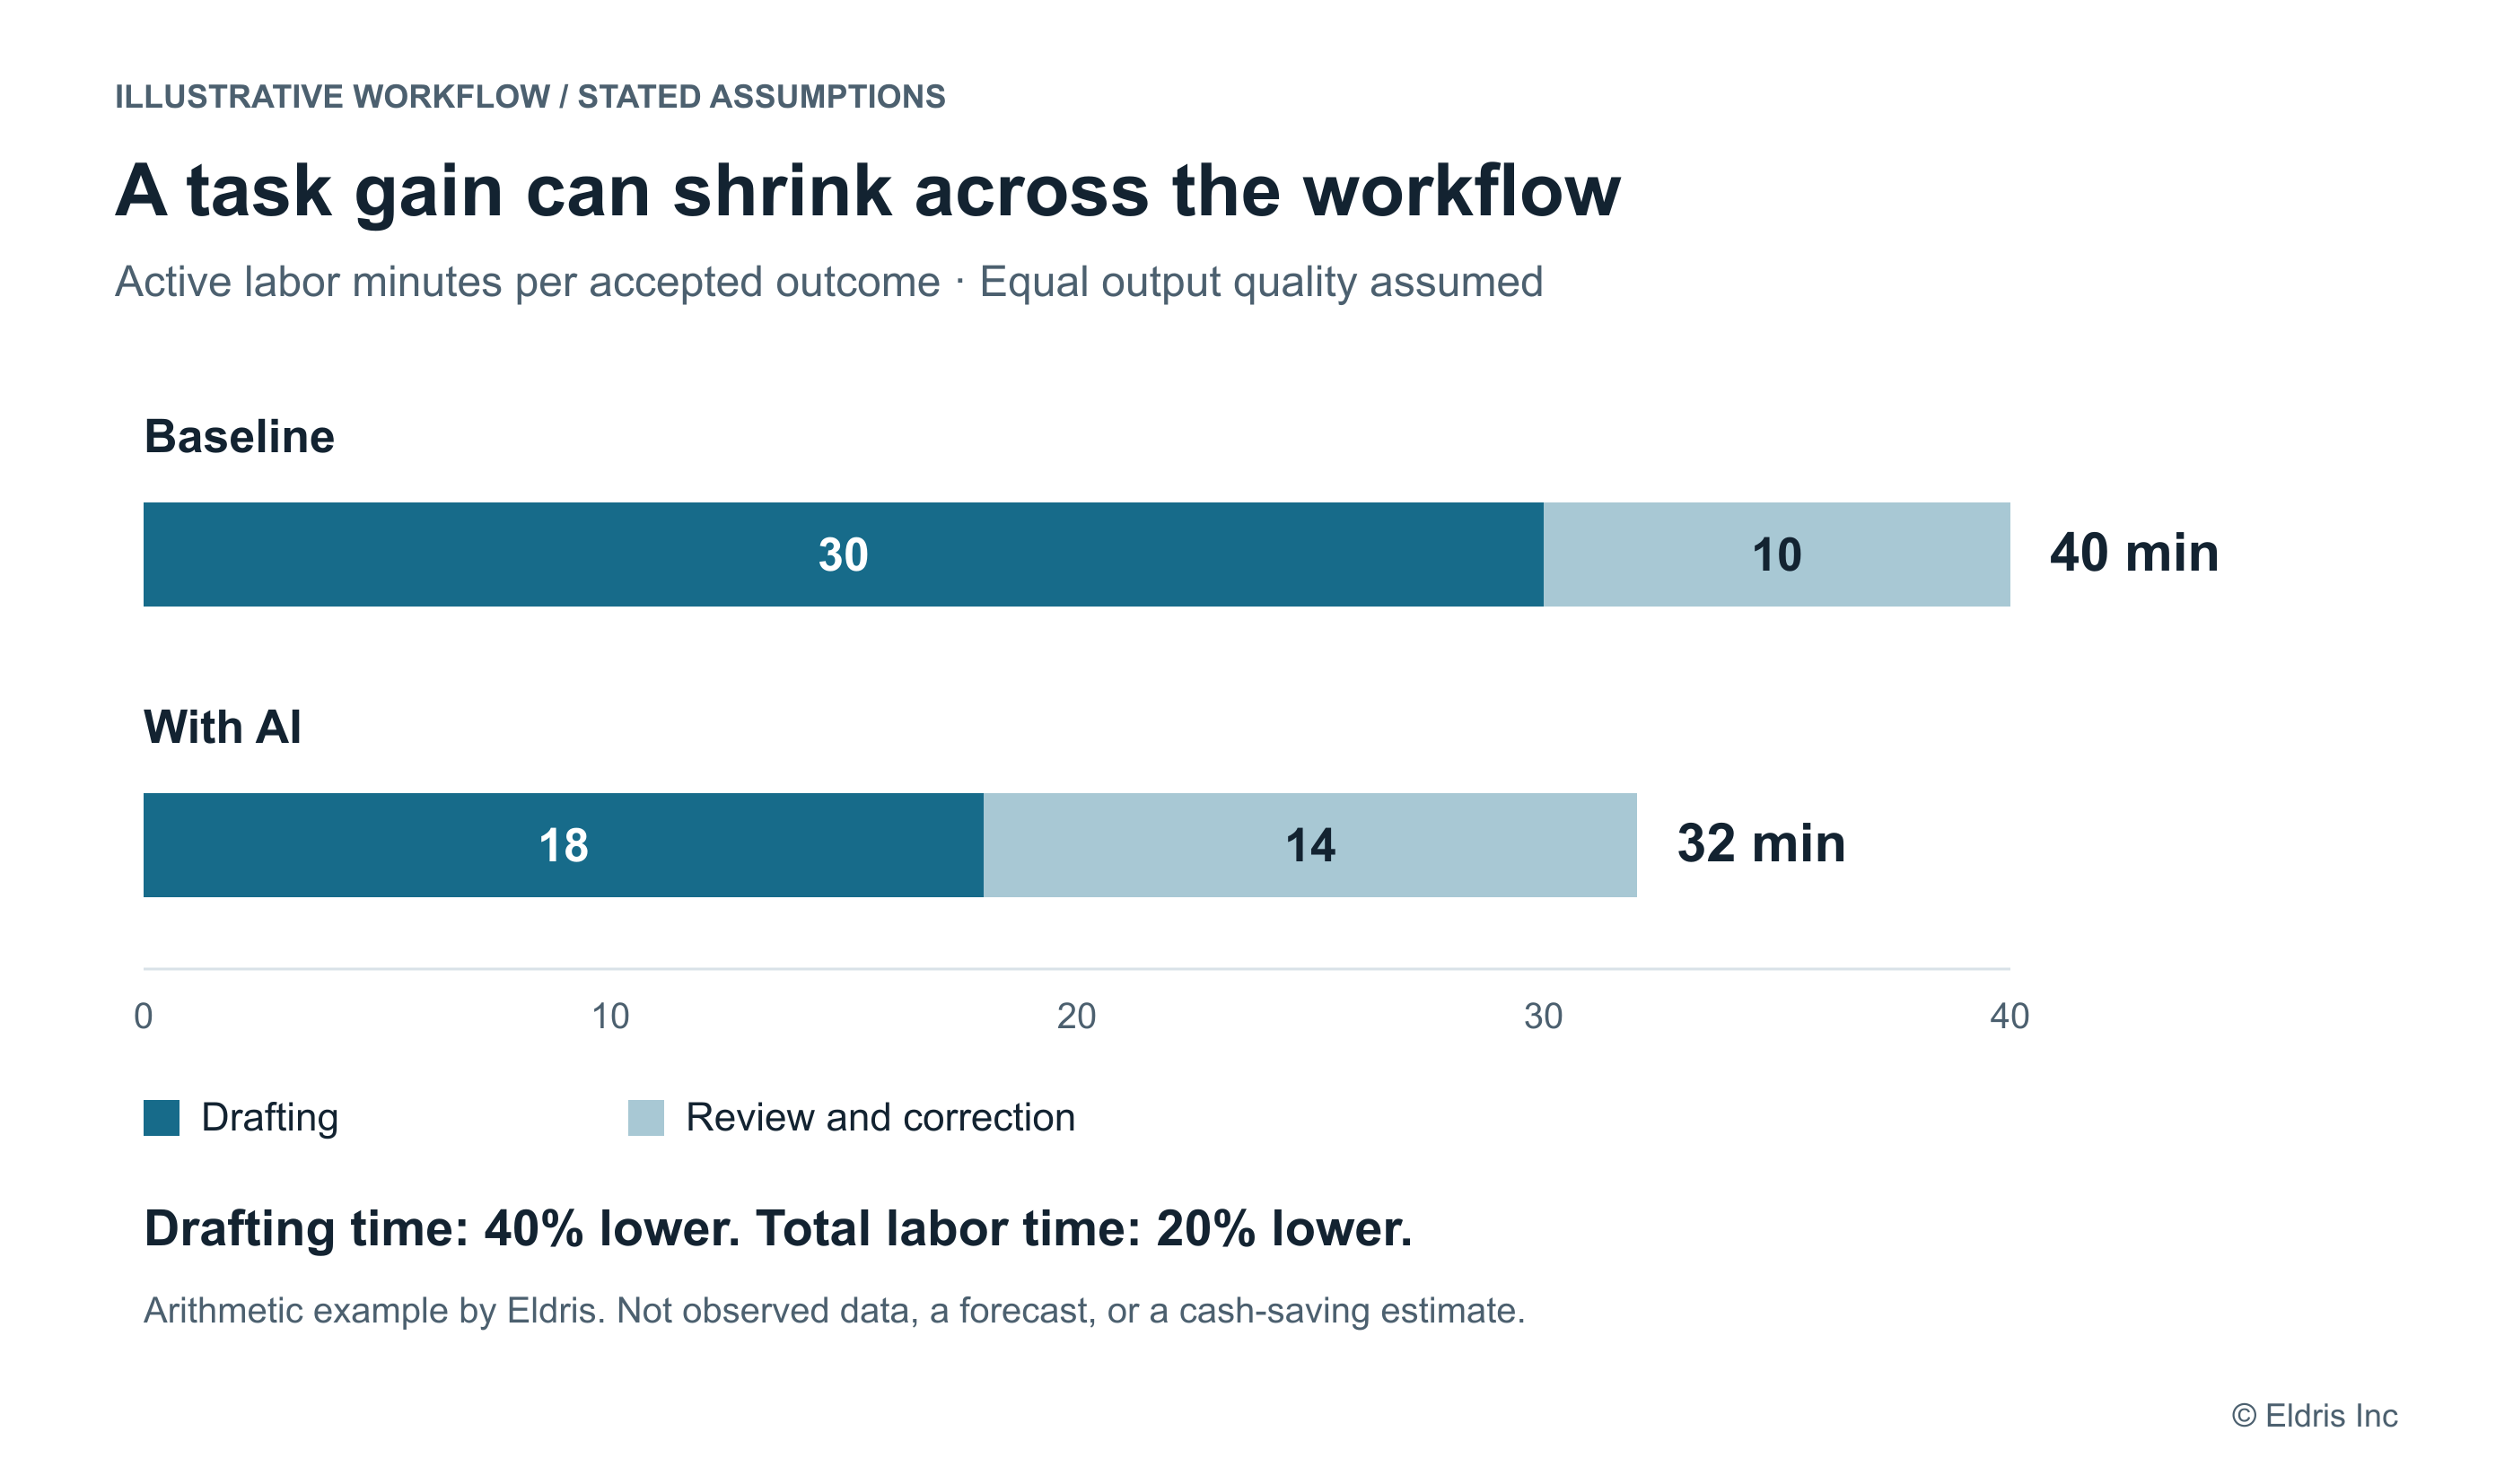
Figure 2. A large task gain can become a smaller workflow gain. An Eldris worked example, not an observed study result. It assumes identical accepted output quality and no omitted labor stages. The bars measure active labor time, not elapsed turnaround time.
In the example, drafting falls from 30 to 18 minutes, a 40% reduction. Review and correction increase from 10 to 14 minutes. Total labor falls from 40 to 32 minutes, a 20% reduction. Applying the drafting improvement to the entire workflow would overstate the gain.
This arithmetic also distinguishes time from throughput. A 20% reduction in labor per accepted outcome would permit 25% more outcomes per labor hour if demand, scheduling, other resources and quality allowed full utilization. That is a conditional capacity calculation, not a forecast of actual output.
Track three clocks separately:
- Human labor time: Active effort across everyone involved, including reviewers and support staff.
- Elapsed turnaround: Time from the request to an accepted result, including queues and waits.
- Tool execution time: Time the system takes to run, which may overlap with other work.
Do not add overlapping agent runs to human labor time, or interpret reduced screen time as proof of reduced effort. In parallel workflows, specify whether the measure concerns effort, elapsed time or completed output.
Include abandoned attempts and fallback work. Averages calculated only from successful uses can conceal expensive failures. Record the eligible case population, accepted outcomes, rejected outputs, exceptions and their costs.
Management implication: Approve an expansion on evidence about accepted outcomes across eligible cases, rather than the speed of the easiest visible step.
Choose the route from capacity to value
A business case needs a named route to benefit. It can include several routes, but each should have an owner, an observable outcome and a clear accounting boundary.
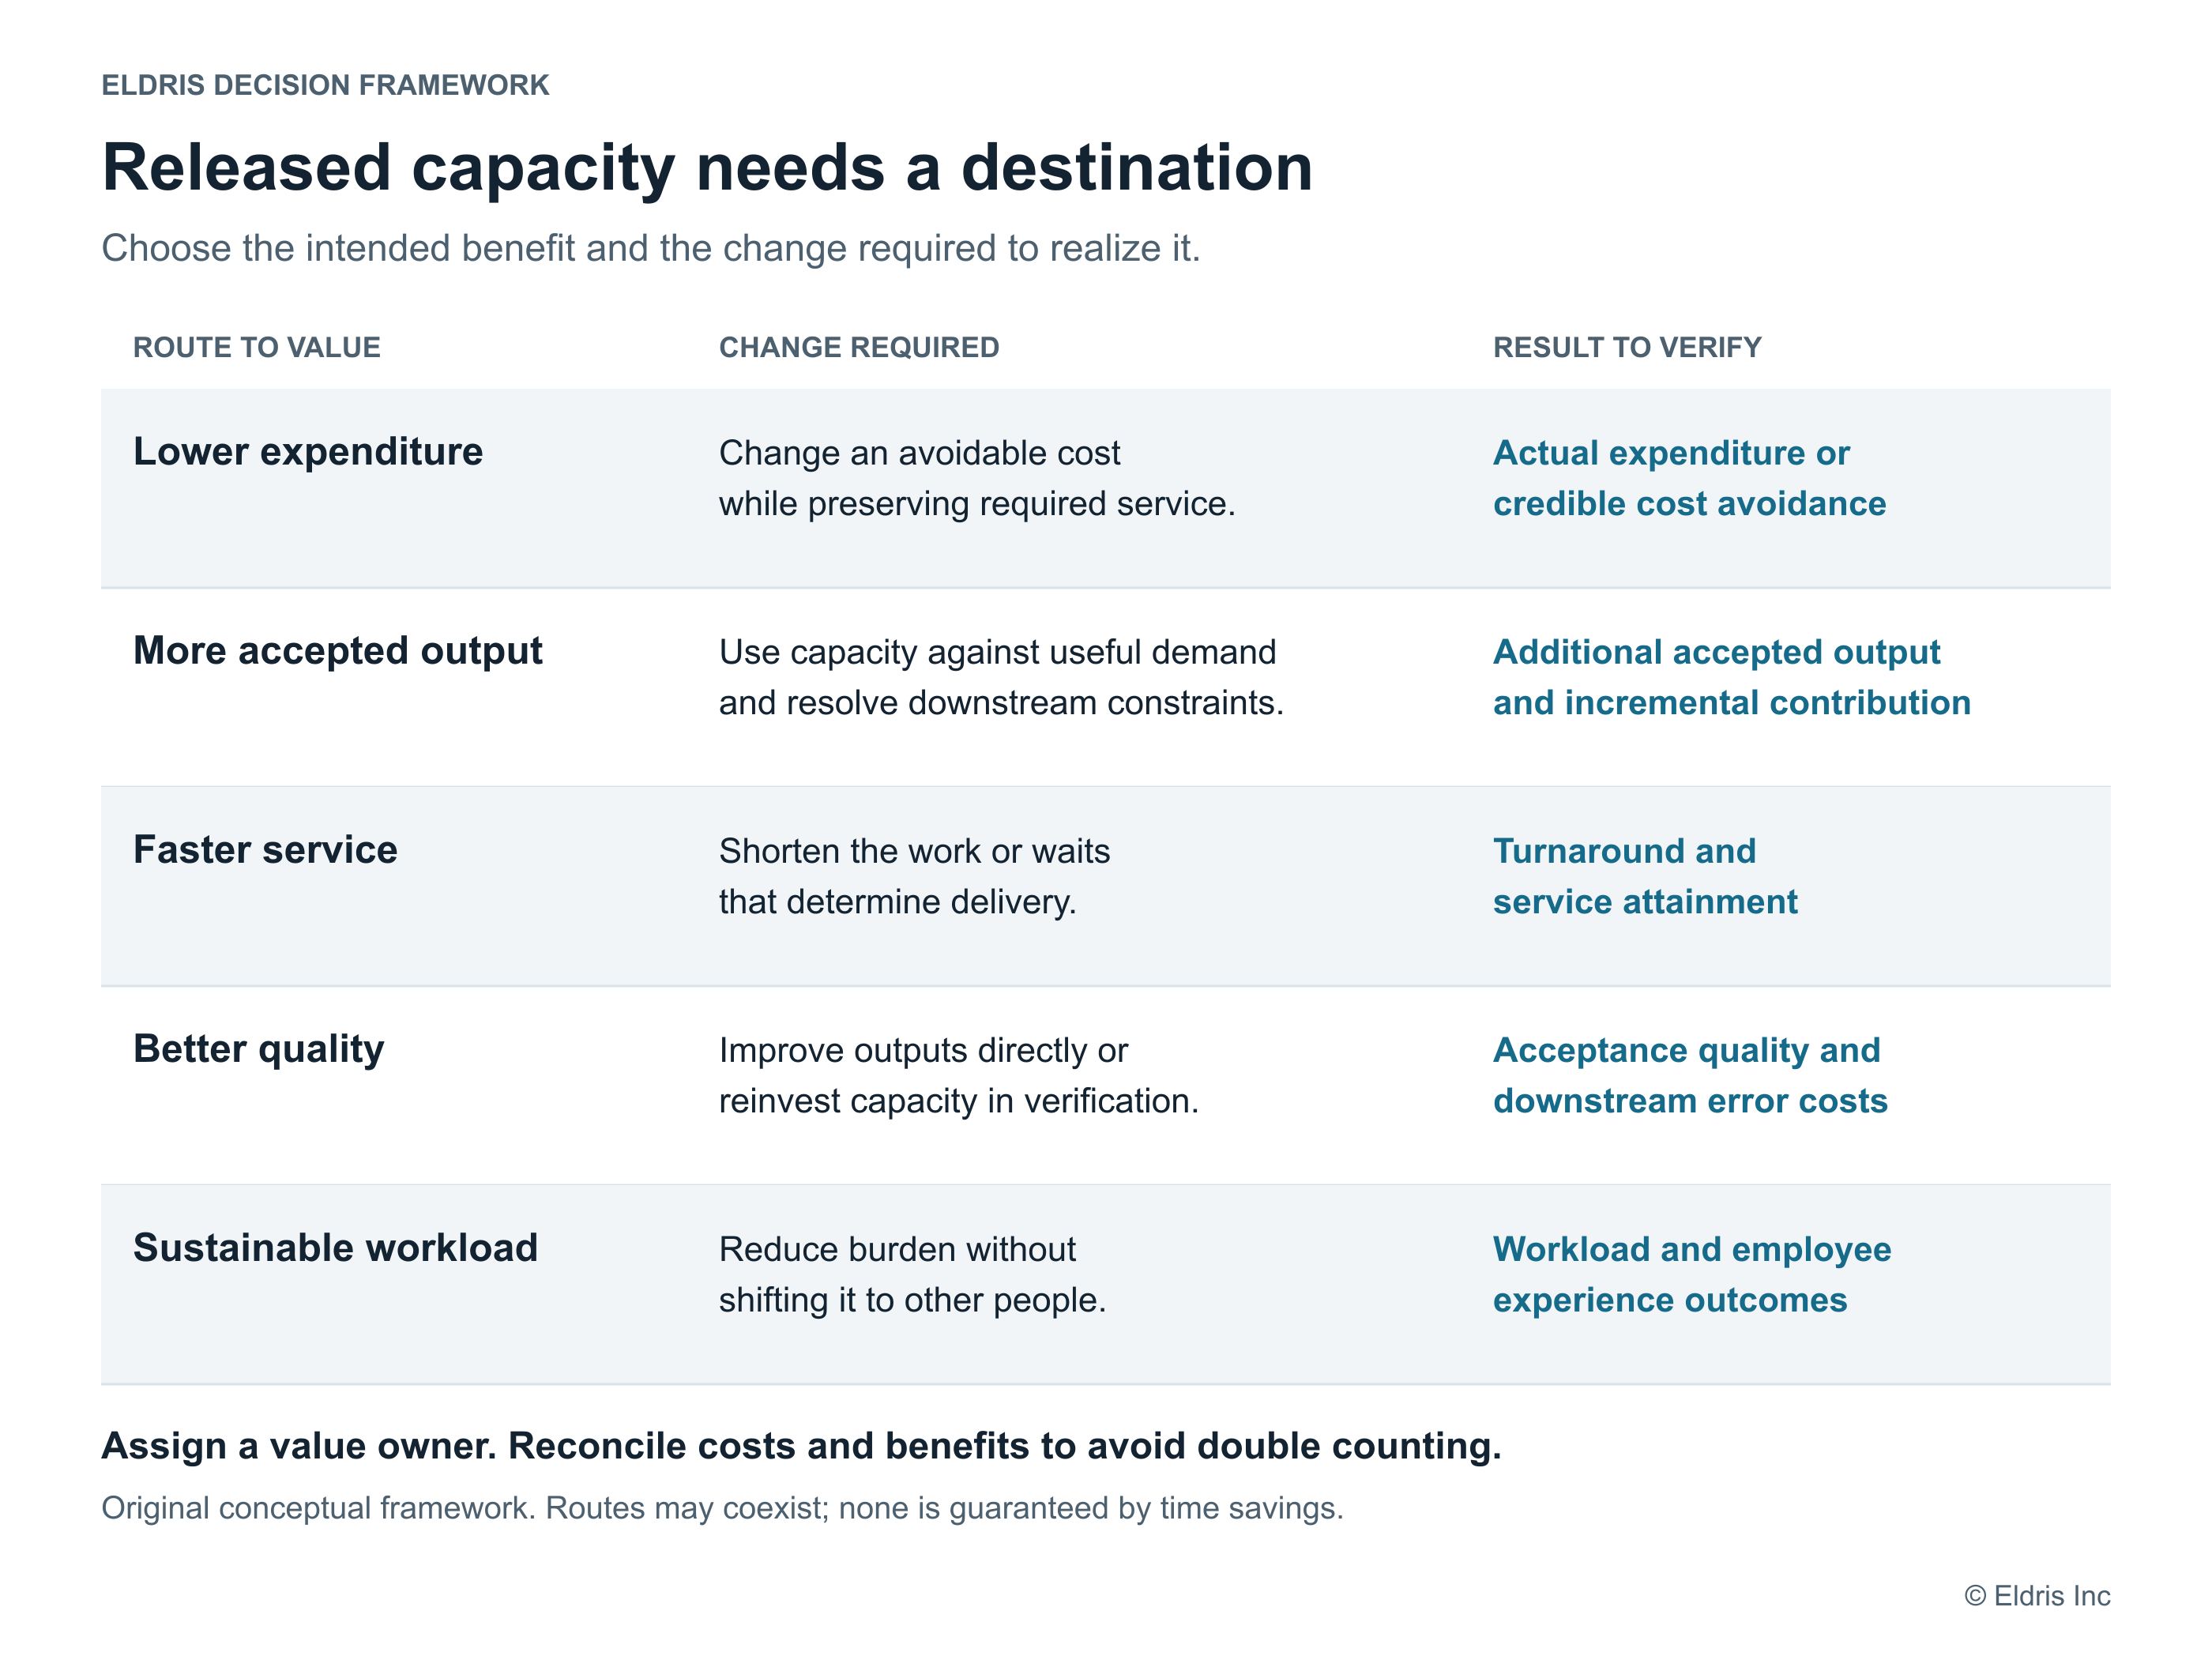
Figure 3. Released capacity needs a destination. An original Eldris decision framework. These are possible routes to value, not a validated sequence or claims about their prevalence.
Lower expenditure
Time savings become an expenditure reduction when the organization changes a cost it would otherwise incur. Examples include lower overtime, reduced external processing spend or a staffing cost change that can actually be implemented.
A claim about avoided hiring needs a credible demand forecast, a documented hiring alternative and evidence that existing capacity can absorb the work. If the planned hire was never likely to occur, its entire cost should not be booked as an AI benefit.
The decision supported is whether the achievable cost reduction exceeds the deployment's incremental costs, including any transition costs, while meeting service and quality requirements.
More accepted output
Released labor can support greater production when there is useful demand and the rest of the process can accommodate it.
Suppose drafting can produce 100 accepted candidates per day, while a required approval step can process only 60. Increasing drafting capacity to 160 leaves maximum completed output at 60 unless approval capacity changes. These are illustrative assumptions. They show why a local gain can enlarge a queue without increasing delivery.
For revenue claims, distinguish additional activity from additional profitable demand. More proposals are not automatically more wins. More deliveries are not automatically additional sales. Measure the relevant downstream result and use incremental contribution after associated costs, rather than counting gross revenue as profit.
The decision supported is whether to expand AI at the current stage, improve the constraining stage first, or redesign the process together.
Faster service
Reduced labor or waiting time may improve turnaround, reliability or customer experience even if the organization spends the same amount and delivers the same volume.
Define the target in service terms: response time, deadline attainment, backlog age or another relevant measure. Examine the distribution as well as the average. A small number of difficult cases can determine whether a service promise is met.
The decision supported is whether the service improvement is worth the cost. A nonfinancial benefit can justify investment if leaders specify its objective and threshold explicitly.
Better quality
A team might use released capacity to check evidence, personalize service or strengthen testing. Alternatively, AI might improve output quality directly. Neither improvement follows automatically from time savings.
Measure quality against explicit criteria and disclose who evaluates it. Where feasible, blind reviewers to the production method. Track serious errors, downstream corrections and customer outcomes, rather than relying only on whether employees like the output.
The decision supported is whether to reinvest capacity in quality, expand a deployment that demonstrably improves it, or tighten the operating boundary when quality deteriorates.
A more sustainable workload
Reduced after-hours work or repetitive effort can be a legitimate benefit even without a spending reduction. Establish whether workload changes, whether work shifts to colleagues, and whether employees experience the intended improvement.
Do not monetize reduced strain, retention or satisfaction as realized savings without evidence for the connection and a defensible valuation. Leaders can approve an employee-experience objective directly.
The decision supported is whether the improvement meets an explicit workforce objective at an acceptable cost.
Build the economics around the relevant alternative
The most useful unit is often fully loaded cost per accepted outcome. It combines the expenditure within the defined workflow and period, divided by the number of outcomes meeting the acceptance criteria. Include failed attempts in the cost numerator even though they do not add accepted outcomes.
A deployment assessment should cover:
- Software, inference and other usage charges.
- Preparation, prompting, review, correction and fallback labor.
- Integration, training, monitoring, maintenance and support.
- Relevant downstream costs and consequences of errors.
- Transition costs and the basis for allocating shared costs.
Distinguish fixed costs from costs that vary with volume. State the horizon used to spread implementation costs. A favorable steady-state estimate does not show that the initial investment will pay back within the required period.
Use two views when necessary. The resource view includes the value of labor consumed or released. The cash view includes expenditures that actually change. Both can be useful, but they support different decisions. Combining unchanged payroll capacity with actual cash savings and calling the result a spending reduction obscures what management must do.
For a financial business case, calculate incremental contribution and avoidable expenditure against the credible alternative, then subtract the incremental costs of the deployment. Keep unmonetized benefits visible alongside that calculation. Do not count the same released capacity both as labor savings and as the labor enabling additional output, unless the allocation and remaining cost changes are reconciled.
The alternative might be the current process, a simpler automation, improved training, outsourced capacity or a narrower AI deployment. Compare options at equivalent service and quality requirements. A pilot that beats a weak baseline may still be a poor investment relative to another feasible option.
Management implication: Present a resource case and a cash case separately, then identify the management action required to turn projected benefit into a realized result.
Design the evaluation to uncover the actual result
A decision-focused study should permit gains, no material change and deterioration. Define acceptance rules before examining results; do not redefine success around whichever metric improves.
Start with the target population and decision. For example: should an organization expand an assistant to a defined support team handling a specified class of cases? That is more actionable than asking whether AI improves productivity in general.
Where feasible, randomize access or use a planned rollout with a credible comparison. Account for shared workflows, learning and spillovers when choosing the unit of assignment. When randomization is unavailable, use comparable work and disclose selection, seasonality, case complexity and other changes that limit causal attribution.
Measure assignment, actual use and sustained use separately. Report eligible participants and cases, exposure, completion and attrition. Excluding nonusers or failed cases changes the question being answered and may bias the business case.
Observe a period covering representative demand and operating cycles. Include the time needed to learn the tool and the ongoing burden after implementation. Specify whether the decision concerns early rollout economics or steady-state performance.
Segment results only where the data support it. Differences by experience, task complexity or location may identify where an expansion is useful, but small subgroups and exploratory comparisons should not become confident deployment rules. In multinational settings, check that the same accepted outcome and cost boundary are meaningful across languages, business units and local processes.
Report uncertainty. Sensitivity analysis should show how the decision changes with utilization, review burden, failure rates and costs. If plausible assumptions reverse the recommendation, identify the next measurement that would resolve it.
Management implication: Commission research around a specific allocation decision, with enough operational data to distinguish competing actions.
What to request at the next investment review
Replace a headline about hours saved with a short decision record.
| Required evidence | The question it resolves |
|---|---|
| Defined workflow, eligible cases and acceptance criteria | What result are we buying? |
| Baseline, comparison and observation period | What would happen without this deployment? |
| Labor through acceptance, elapsed time and quality | Did the relevant work improve? |
| A named benefit route and accountable owner | What operational action converts the gain? |
| Full costs, incremental economics and uncertainty | Is the next investment justified? |
| Conditions for expansion, revision or stopping | What will management do with the evidence? |
Apply that record to the next action:
- Expand when the target benefit persists at acceptable quality and cost, and the operating prerequisites exist in the next population.
- Redesign when the task improves but review, queues or downstream constraints prevent the intended result.
- Narrow when evidence supports particular tasks or populations rather than the proposed broad rollout.
- Measure further when the uncertainty could change the decision and the additional evidence is worth acquiring.
- Stop or replace when the deployment fails the agreed threshold and a credible alternative better serves the objective.
These are conditional recommendations, not findings that one action is right for every organization.
The central recommendation is to require a value owner alongside a technology owner. The technology owner manages the system. The value owner is accountable for the operational change and evidence of benefit: absorbing demand, reducing avoidable spending, improving service, raising quality or easing workload.
A productivity claim becomes decision-useful when it identifies an accepted result, a credible alternative, a route to benefit and an action the organization can actually take.
Method and limitations
This brief selectively reviews primary research checked on October 3, 2026. It is not a systematic review, meta-analysis, original participant study or reanalysis of underlying datasets. It does not estimate a universal AI productivity effect or the return on a particular deployment.
Study findings retain their distinct populations, units and historical tool conditions. The later METR qualification is included to avoid treating an early-2025 result as a current benchmark. Employment or commercial relationships relevant to the reviewed work should be considered alongside the designs; the NBER work-patterns study discloses that some authors worked at Microsoft, the tool provider, and that authors retained discretion over results.
The decision framework, worked examples and recommendations are Eldris interpretations. Illustrative numbers are stated assumptions, not proprietary observations, forecasts or synthetic participant data. Their arithmetic explains a mechanism; it does not establish how often that mechanism occurs. The recommendations require validation against the organization's actual work and constraints.
Sources
- Brynjolfsson, E., Li, D., and Raymond, L. Generative AI at Work. Revised manuscript, November 6, 2024; subsequently published in The Quarterly Journal of Economics, 140(2), 2025, pp. 889-942. This brief uses the revised 5,172-agent sample and 15% estimate, rather than the earlier working-paper figures. Revised paper and journal record.
- Dillon, E. W., Jaffe, S., Immorlica, N., and Stanton, C. T. Shifting Work Patterns with Generative AI. NBER Working Paper 33795, May 2025, revised November 2025. Six-month experiment; 66 firms and 7,137 workers. The two-hour email result concerns users among those assigned access in the experiment's second half. Paper and disclosures.
- Becker, J., Rush, N., Barnes, B., and Rein, D. Measuring the Impact of Early-2025 AI on Experienced Open-Source Developer Productivity. METR, July 10, 2025. Randomized task assignment among 16 developers and 246 tasks; completion time and perception are distinct measures. Study and limitations.
- Becker, J., Rush, N., Cunningham, T., Rein, D., and Mahamud, K. We are Changing our Developer Productivity Experiment Design. METR, February 24, 2026. Follow-up explains selection and measurement problems; this brief does not use its raw estimates as reliable current productivity effects. Follow-up.