
Executive brief
An AI adoption percentage becomes useful when it tells a business leader something about a decision. Before using it to justify investment, compare competitors, or evaluate a rollout, establish what was counted, whose activity was measured, and what outcome the number can support.
A business can count as an AI user because someone uses an assistant for occasional work. Another measure may concern use within a business function. A third may describe deployment across an enterprise. None, by itself, establishes sustained reliance, acceptable performance, or financial return.
This report recommends separating five questions:
- Access: Who can use AI for the relevant work?
- Use: Who actually uses it, and how often?
- Operational integration: Where does it participate in an approved business process?
- Sustained use: Does useful activity continue beyond initial experimentation?
- Realized value: What business outcome improves, after accounting for relevant costs and consequences?
For executives, the immediate action is straightforward: replace an undifferentiated adoption target with measures tied to the specific decision being made. A license expansion needs evidence about useful demand. Production approval needs evidence about performance and control. Scaling needs evidence about repeatability and economics.
Public statistics can provide context for those decisions. Internal evidence must establish whether the proposed action makes sense for the organization.
Different adoption numbers answer different questions
Consider four published accounts of business AI use. Their figures describe different populations and measurement boundaries.
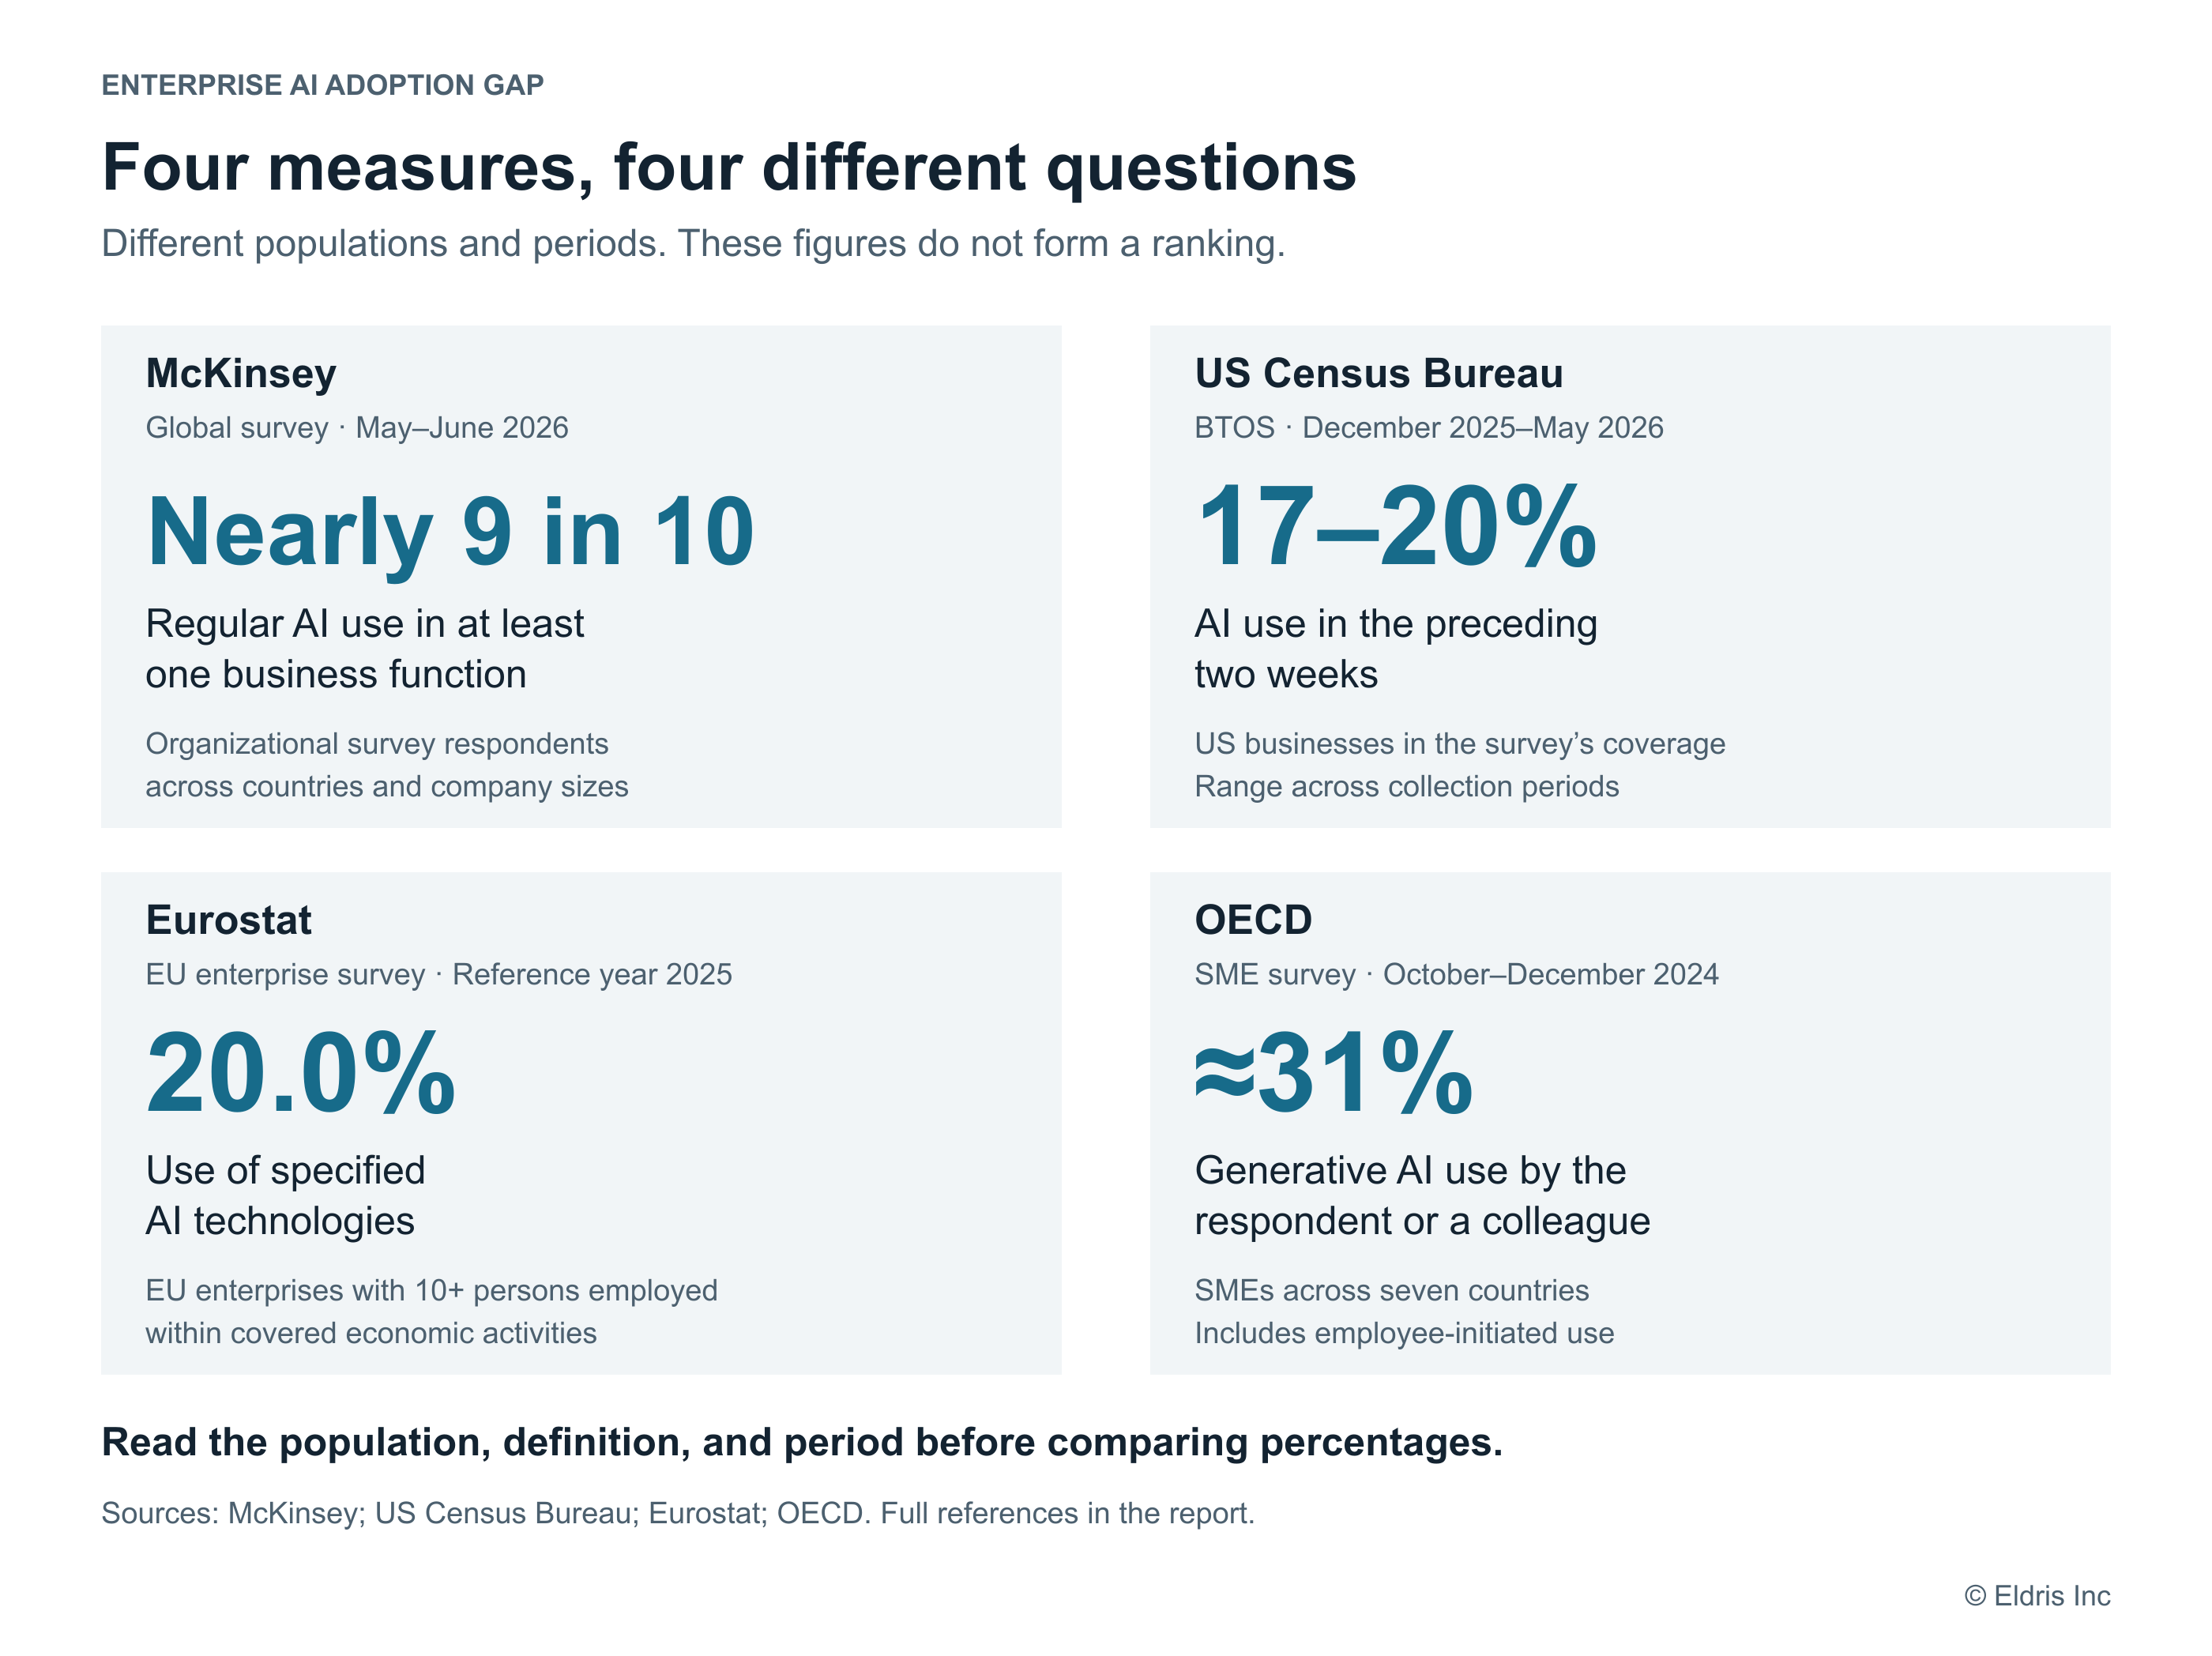
Figure 1. Four measures, four different questions. Each result retains its population and period. The Census figure is a range across collection periods, not a confidence interval. These snapshots are not a common market ranking.
Sources: McKinsey 2026 State of AI; US Census Bureau, May 2026 analysis; Eurostat, 2025 enterprise AI use; OECD, How are SMEs using generative AI.
These results should not be averaged, arranged as a competitive league table, or used to calculate a single global adoption rate. A difference between them is not evidence, on its own, that one geography is ahead or one survey is wrong.
The business question determines which measure is useful. An estimate covering many small firms may be relevant to a broad small-business market. A survey of organizational respondents may illuminate enterprise practices. Neither should automatically become the benchmark for a specific multinational workflow.
Population and weighting change the meaning
McKinsey received 1,719 responses across 97 nations, with country weighting based on contributions to global GDP. This is a different basis from weighting a business population by firm counts. McKinsey methodology
The OECD study covered 5,232 SMEs, including one-person companies, in Austria, Canada, Germany, Ireland, Japan, Korea, and the United Kingdom. It used stratified telephone sampling and firm-based weighting. Firms whose technology-informed respondent was unaware of generative AI were screened out of the main interview but accounted for in the use estimate. OECD methodology
A percentage of firms and a percentage of employment represented by those firms answer different questions. Likewise, a company with some AI use and a company in which most relevant employees use AI are different observations. Always identify the unit and denominator before drawing a comparison.
The definition can move while the technology spreads
Trend interpretation requires stable measurement. The Census Bureau changed its core question in November 2025, broadening it from AI used in producing goods or services to AI used in any business function. A comparison spanning that change combines a different measurement boundary with any underlying change in behavior. US Census Bureau explanation
Eurostat also notes that its 2025 questionnaire added a category for generating pictures, video, and audio. The published increase over 2024 should therefore be read alongside that instrument change; the headline alone does not isolate how much reflects expanded measurement. Its coverage includes specified industries, rather than every economic activity. Eurostat methodological notes
The OECD explicitly discusses why its generative AI estimate differs from national statistical surveys: definitions, employee-initiated use, collection dates, and participation may all contribute. Among its generative AI users, only 29% reported use in their company's core activities. That distinction shows why any-use measures should not be treated as measures of core operational integration. OECD findings and comparison discussion
Management implication: Preserve question wording and definitions in internal dashboards. When changing a measure, document the break. Where feasible, collect the old and new definitions together for a transition period instead of silently connecting the series.
Use does not establish value
In McKinsey's 2026 survey, 80% of respondents reported improved individual productivity, while 37% attributed some positive enterprise EBIT impact to AI. These are distinct reported outcomes, not a measured conversion funnel. Their difference does not establish the cause of a value gap, and the remaining respondents cannot be classified as failed deployments from these figures alone. McKinsey findings
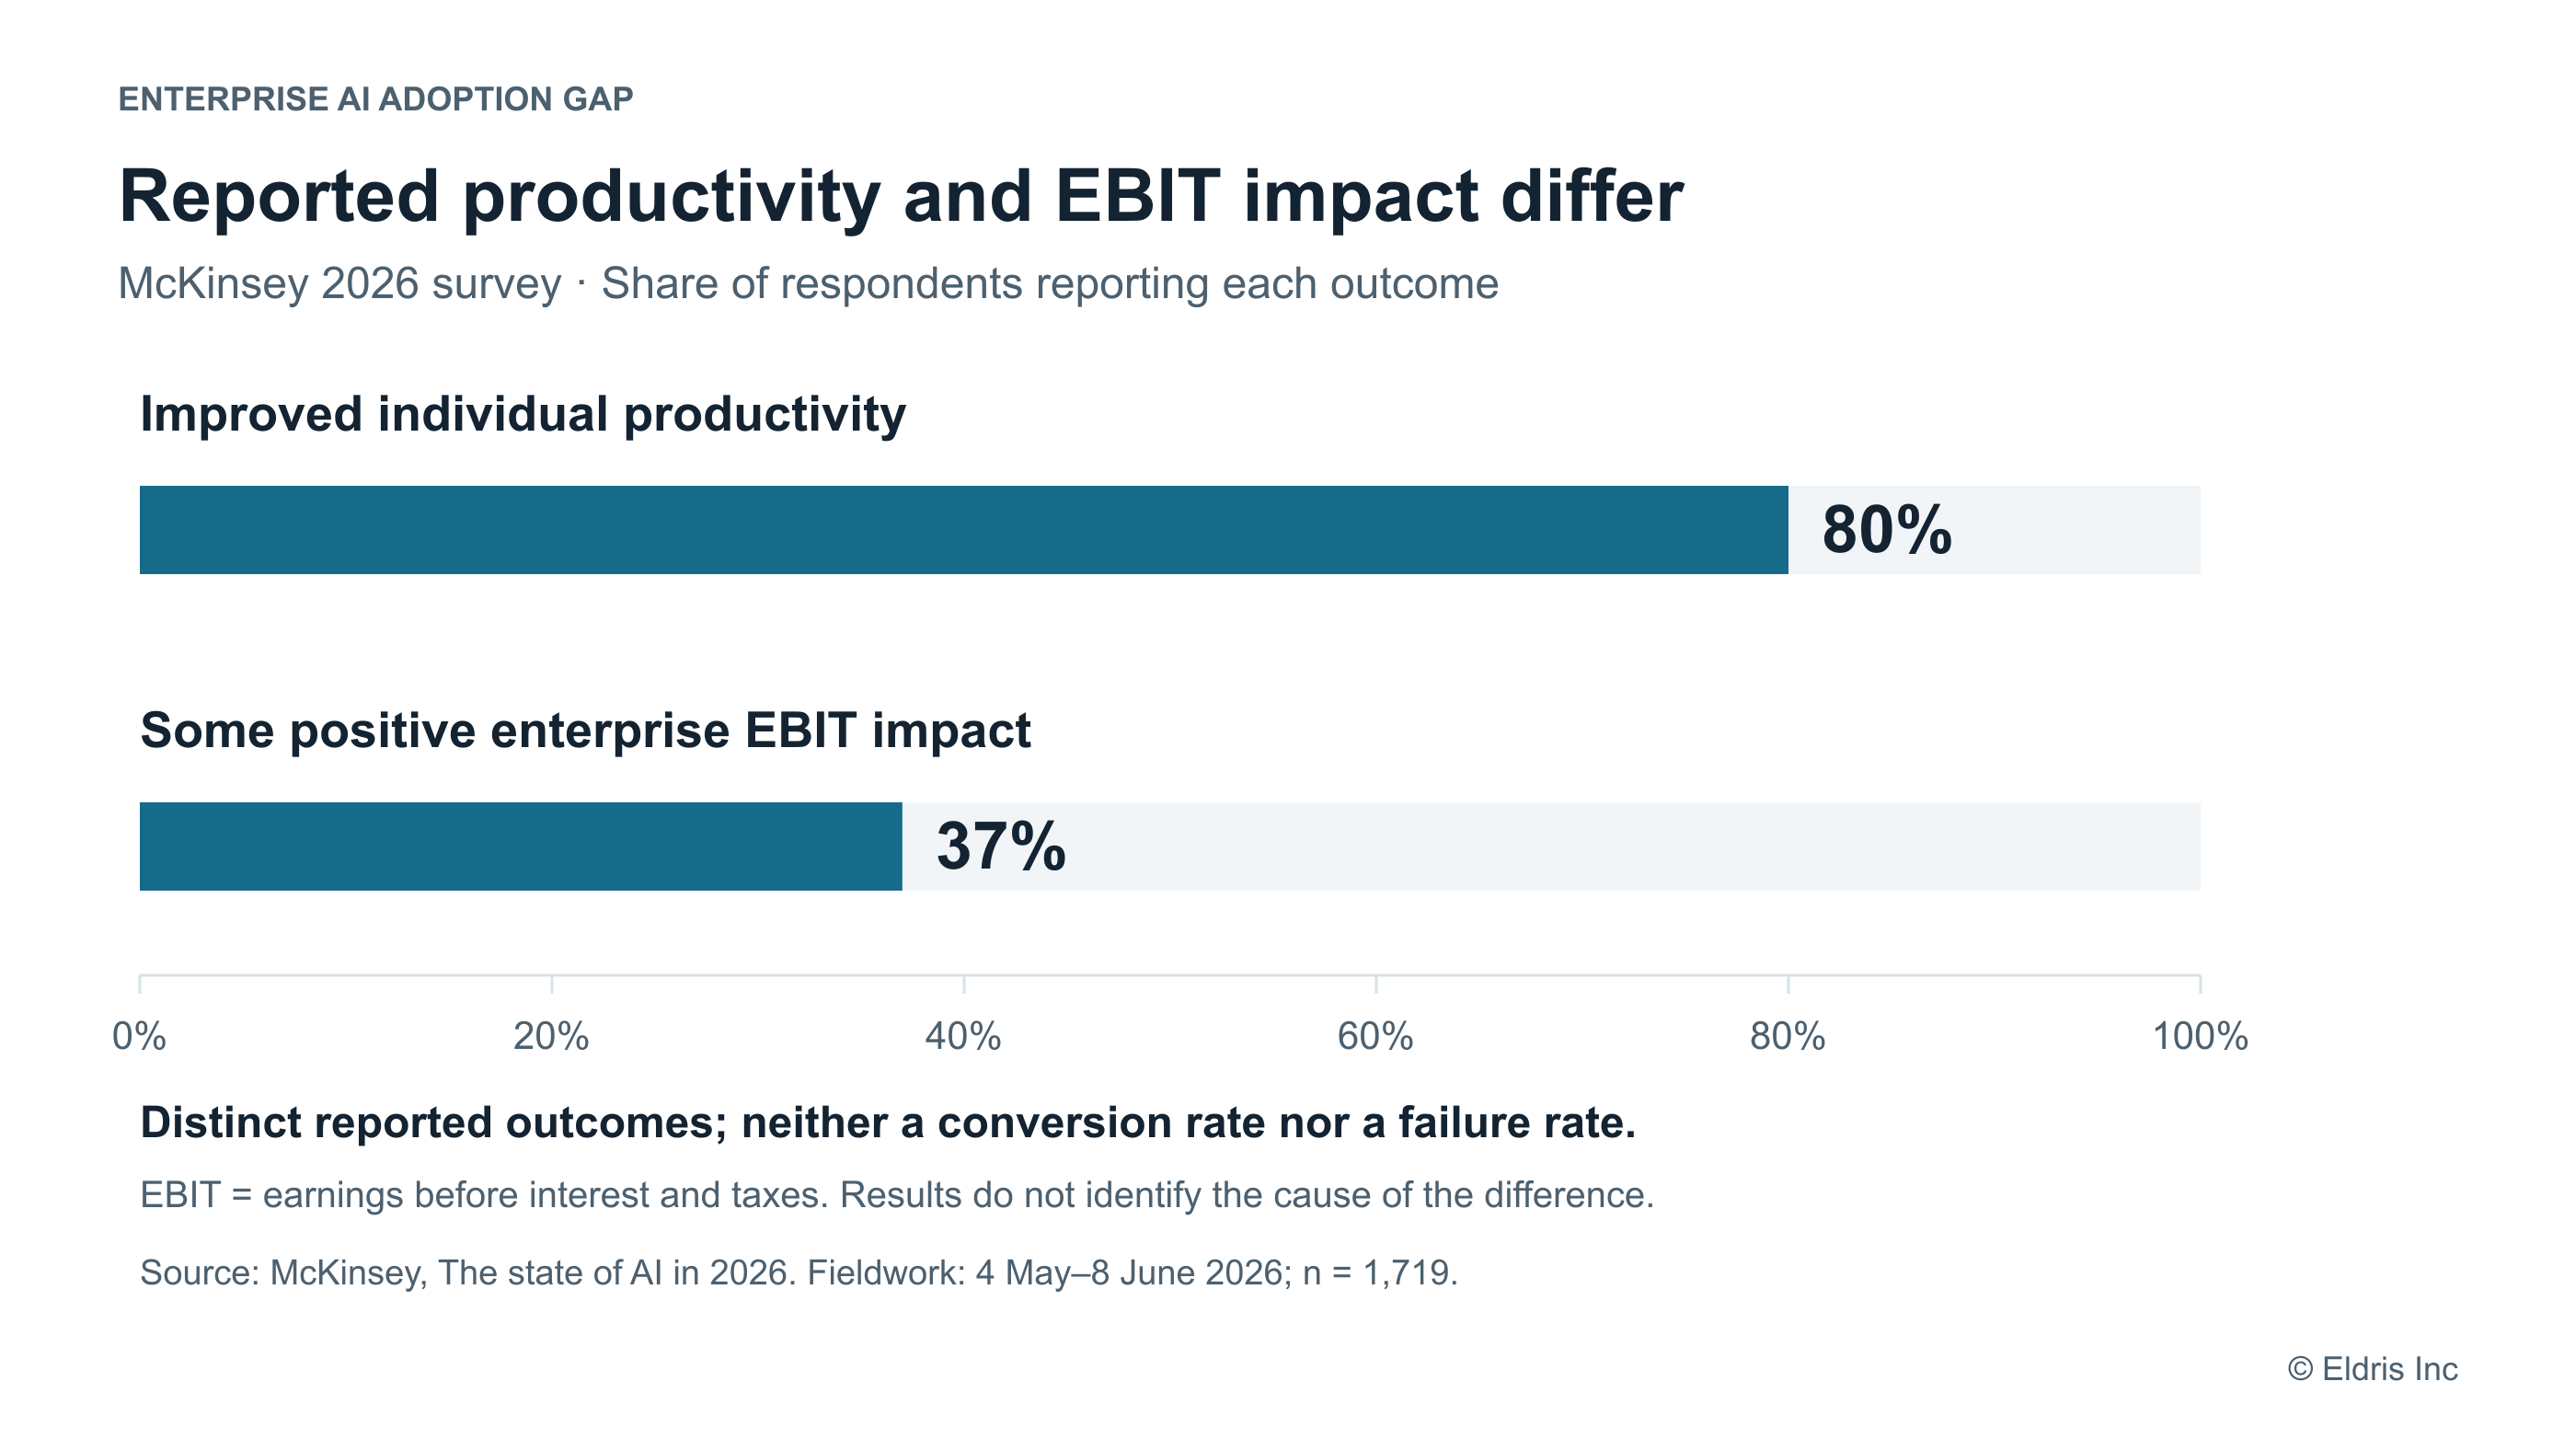
Figure 2. Individual productivity and enterprise financial impact are different outcomes. The bars show shares of respondents, not the size of productivity or profit improvements. Sample size refers to the overall survey. Source and methodology.
Our interpretation is that executives need an explicit account of how an improvement in a task becomes an improvement in the business.
For example, faster drafting could reduce turnaround time, accommodate more work, improve quality, or simply create unused capacity. These are possible pathways, not findings established by the surveys reviewed here. The relevant pathway depends on the organization's objective and operating constraints.
Time savings are particularly easy to overstate. Multiplying reported hours saved by a salary rate produces an estimate of capacity value under assumptions. It does not demonstrate a reduction in expenditure. Financial savings require a change in costs; throughput gains require additional accepted output; revenue gains require evidence that connects the change to sales.
Costs should include the work needed to obtain an acceptable outcome: software, integration, review, correction, exceptions, training, and ongoing operations where relevant. A comparison must also account for changes in quality and risk. More use is not a desirable outcome if it increases errors or consumes resources without advancing the business objective.
Management implication: Define the intended business benefit before reporting adoption as success. Measure that benefit directly where possible, and identify the assumptions when direct measurement is unavailable.
A proposed framework for measuring adoption
The following framework is our organizing tool for enterprise measurement. It is not a validated maturity scale or an estimate derived from the public surveys. Its purpose is to separate distinct evidence needs.
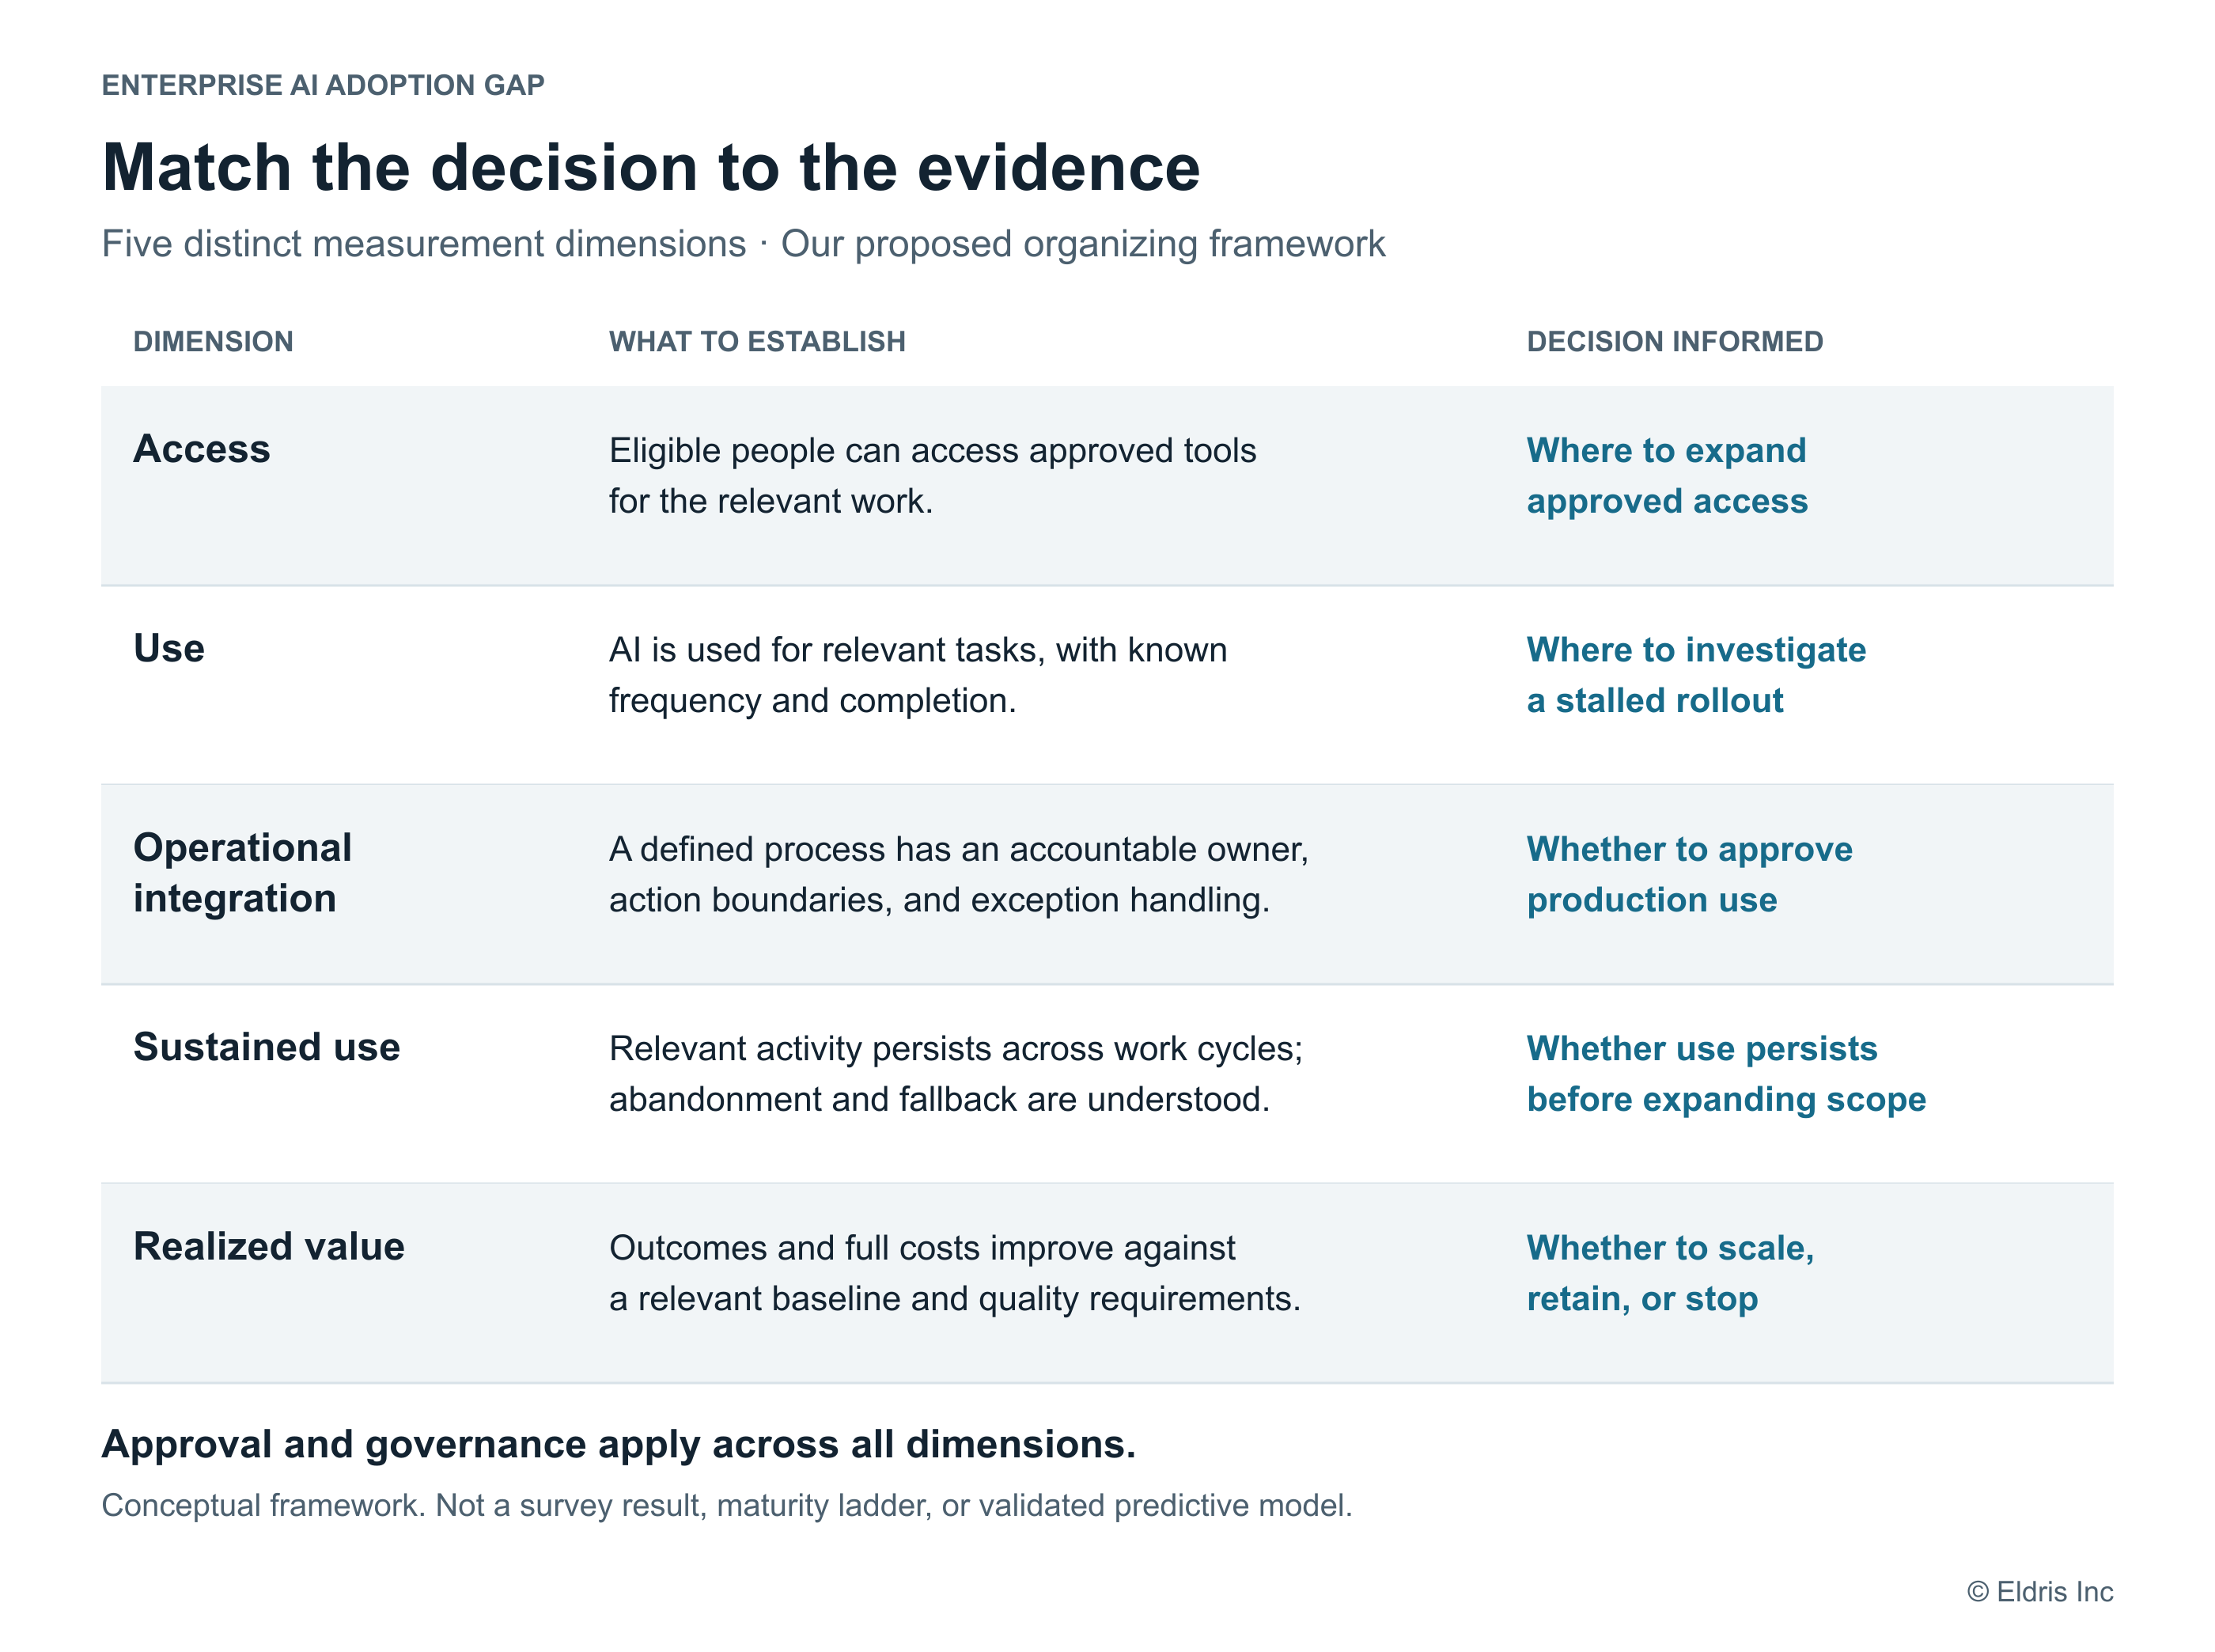
Figure 3. Match the decision to the evidence. An original conceptual map of measurement dimensions and decisions they inform. Each dimension supplies part of the evidence; decisions also require the performance, cost, and contextual checks described in Section 5.
Approval and governance should be recorded across these dimensions. They are not inferred from usage logs. An employee can use an unapproved tool; a properly approved system can remain unused.
Nor should the dimensions be treated as a compulsory sequence. Different workflows may develop differently, and a business can realize value from a narrow deployment without pursuing company-wide use. The appropriate target is the scope that serves the business objective.
Define the denominator for each measure
For a particular workflow, a team might track:
- Access coverage: People with approved access divided by people eligible for the task.
- Relevant use: Eligible people who complete the defined AI-assisted task during the measurement period divided by the eligible population.
- Workflow coverage: Eligible cases processed with AI assistance divided by all eligible cases.
- Sustained use: People or teams continuing relevant use after a defined interval divided by the original starting cohort, with exits and attrition disclosed.
- Outcome economics: Fully loaded cost per accepted outcome, compared with the relevant baseline and quality requirements.
Eligibility must be defined before examining results. Report counts as well as percentages. A high rate among a carefully selected small team should not be presented as company-wide adoption.
The measurement interval should match the work. Weekly use is relevant to a weekly task; it is a poor standalone target for work that occurs quarterly. Mandatory activity should also be distinguished from voluntary repeated use.
Match the evidence to the decision
The practical benefit of separating measures is that it helps leaders locate the next question to resolve before spending more.
| Decision | Evidence needed | Action supported when that evidence is sufficient |
|---|---|---|
| Expand access | Useful demand from eligible users, capacity constraints, and costs | Extend access to the population with a credible need |
| Approve production use | Performance under realistic conditions, authority boundaries, and exception handling | Authorize a defined workflow with explicit conditions |
| Fix a stalled rollout | Evidence distinguishing relevance, usability, approval, reliability, and training problems | Address the demonstrated obstacle rather than apply a generic adoption campaign |
| Scale a deployment | Sustained outcomes, repeatability, support burden, and full costs | Expand to contexts where the evidence and prerequisites apply |
| Retain or stop an initiative | Business outcomes against agreed thresholds and alternatives | Continue, narrow, redesign, or discontinue on a documented basis |
These are conditional recommendations. A usage statistic can identify a question; it usually cannot identify the cause of a problem. Low repeat use, for example, warrants investigation into task relevance and experience. It does not automatically justify more training.
Choosing external benchmarks
Use an external comparison only after checking population, company size, industry, geography, technology scope, question wording, period, and denominator. Report material mismatches alongside the number.
For multinational enterprises, preserve a common definition while reporting the relevant differences between business units. A headquarters average can conceal variation in eligible tasks, deployment permissions, language requirements, or operating conditions. This is a measurement recommendation, not a finding that those factors caused differences in the surveys above.
When a comparable benchmark is unavailable, do not manufacture one from unrelated headlines. Use an internal baseline and a decision threshold instead. The question becomes whether the next investment improves the intended outcome enough to justify its costs and constraints.
A checklist for the next executive review
Before an adoption percentage enters a funding proposal or board presentation, ask:
- [ ] Who is counted? Firms, respondents, employees, teams, workflows, or cases?
- [ ] What qualifies? Access, any use, regular use, approved deployment, or measured benefit?
- [ ] What technology is covered? AI broadly, generative AI, assistants, or agents?
- [ ] What is the denominator? All organizations, eligible users, AI users, or a selected subgroup?
- [ ] When was activity measured? Distinguish fieldwork dates, reference periods, publication dates, and future intentions.
- [ ] How was the estimate produced? Recruitment, weighting, uncertainty, and relevant coverage limits.
- [ ] Has the measure changed? Check question wording, technology categories, sampling, and definitions.
- [ ] What decision follows? Name the action, required threshold, and evidence still missing.
For the next internal review, ask each material AI initiative to present five items on one page:
- The business objective and accountable owner.
- The eligible workflow and population.
- Actual use and sustained use over a relevant period.
- Outcome quality and fully loaded costs against a stated baseline.
- The decision requested, with conditions for expansion, revision, or stopping.
This is the central recommendation of the report: use public adoption statistics to understand the landscape, and use decision-specific evidence to determine the organization's next move.
Method and limitations
This brief is a selective review of primary public sources, checked on October 3, 2026. It does not report new participant research, a pooled estimate, a systematic review, or a reanalysis of respondent-level data. The published figures retain their original populations and definitions. Historical examples are labeled by period and are not presented as the latest reading of continuously updated series.
The five-dimension framework, measures, checklist, and management recommendations are our original interpretation. They have not been validated as a predictive model. The reviewed sources do not establish the causal effect of these recommendations or determine the return on any particular enterprise investment.
Source notes
- McKinsey, The state of AI in 2026: On the road to ROI. Published August 25, 2026; online fieldwork May 4 to June 8, 2026. Organizational information is respondent-reported. Report and methodology.
- US Census Bureau, Large Firms With at Least 20 Employees Biggest AI Users. Published May 26, 2026; analysis covers collection periods from December 14, 2025 through May 3, 2026. Current-use and expected-use measures are distinct. Article.
- Eurostat, 20% of EU enterprises use AI technologies. Published December 11, 2025; reference year 2025. Covered activities are NACE Rev. 2 sections C through J, L through N, and group 95.1; the minimum size is 10 employees or self-employed persons. Release and methodological notes.
- OECD, Generative AI and the SME Workforce. Published 2025; main fieldwork October 14 to December 6, 2024. The approximate 31% measure concerns generative AI use; the 29% core-activity figure is conditional on being a user. Methods and findings.