
Executive brief
A board sees an AI adoption figure from another country. A product team uses a global survey to estimate demand. A multinational sets the same deployment target for business units with different work. Each is transferring evidence from one setting into a decision about another.
That transfer may be useful. It may also change the question without anyone noticing.
A benchmark is not portable merely because its source is credible. It must measure a relevant outcome in a population whose characteristics and operating conditions support the proposed comparison. Differences in firm size, task mix, access, authority, question wording and measurement period can alter the meaning of the result.
This report is for enterprise leaders, strategy teams and AI providers deciding where to invest, which peers to compare against or how broadly to expand a deployment. Its central recommendation is to require a benchmark fit assessment before an external number becomes a target, forecast or reason to spend.
Three rules follow:
- Match the question. Evidence of any AI use cannot answer how many buyers will approve a particular product or how much value a workflow will deliver.
- Examine the population mix. An aggregate difference can reflect who is counted rather than a difference within comparable groups.
- Validate the transfer. Reweighting can address some measured population differences. It cannot repair a different outcome definition or establish performance under new operating conditions.
A benchmark should have a declared role: a usable comparison, an input requiring adjustment and local evidence, background context, or evidence unsuitable for the proposed decision. That role should be visible wherever the number appears.
The business objective is better allocation of resources. A comparable external rate can identify an investigation worth pursuing. It does not, by itself, establish that a business should increase usage, enter a market or replicate another team's rollout.
Changing the unit changes the business question
The OECD's SME research provides a concrete example. Across seven countries, generative AI use was reported in 30.7% of SMEs. Those firms accounted for 38.4% of SME employment. The second figure describes employment in firms reporting use by someone; it does not say that 38.4% of employees personally use AI. OECD findings and note 1.
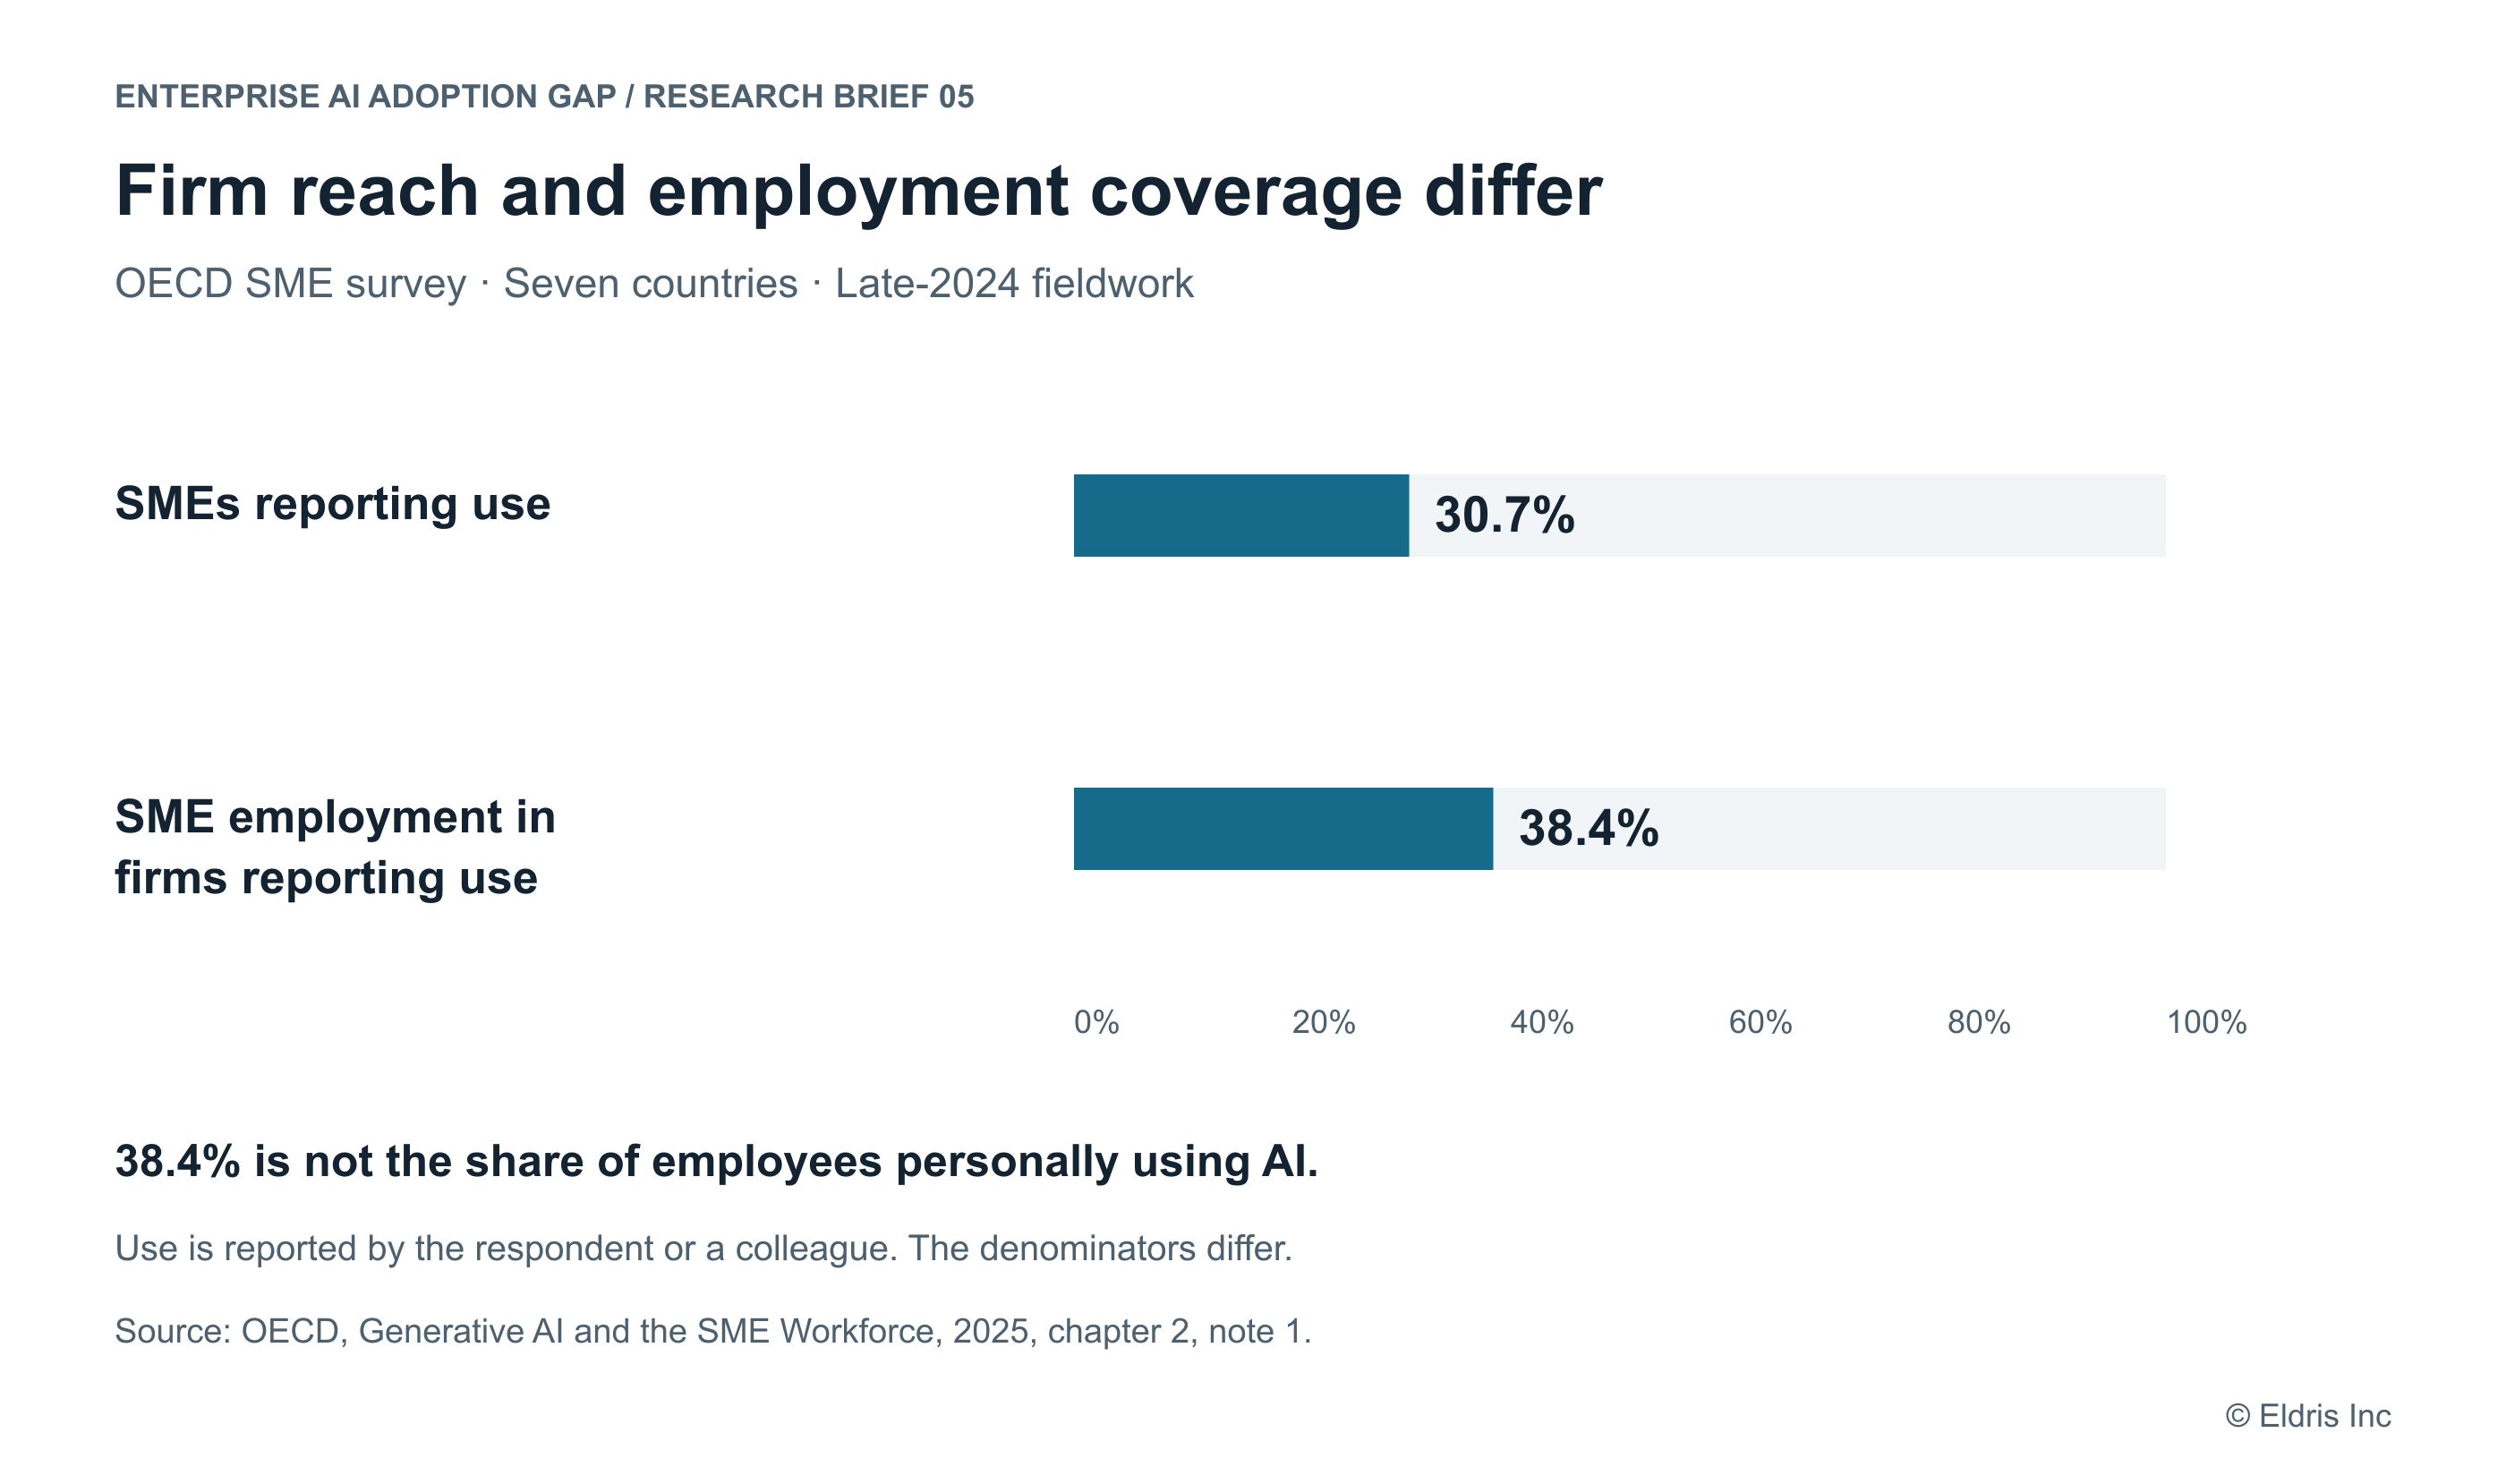
Figure 1. Two denominators describe different forms of reach. Published OECD measures from the same study. Employment coverage is not the share of employees using AI, deployment intensity or revenue exposure.
For a provider selling one subscription per company, firm counts may be relevant to a starting market model. A provider selling seats needs evidence about eligible users, actual demand and purchasing authority. Neither denominator automatically predicts paid customers.
The same distinction applies inside an enterprise. The proportion of business units with any AI activity differs from the proportion of eligible employees using an approved assistant, or the proportion of cases handled within an approved process. A unit with one experimental user should not silently become a fully deployed site.
Write the unit into the claim. “Share of firms reporting any use” preserves the meaning. “AI penetration” often removes the information needed to assess it.
Decision implication: Choose the denominator that corresponds to the resource being allocated. Keep company reach, employee reach, workflow coverage and customer conversion separate.
Population mix can reverse a ranking
Two markets can have different adoption rates because they contain different proportions of firms with work suited to the measured technology. The same issue affects comparisons between business units, customer segments and employee groups.
Consider the following arithmetic example. It uses stated assumptions to demonstrate aggregation; it is not observed research, simulated participant data or a forecast about real markets.
Assume a common definition of AI use and two comparable segments. Segment H has higher use rates; Segment L has lower rates. These labels describe the assumed rates, not the intrinsic value of AI to either group.
| Assumed characteristic | Market A | Market B |
|---|---|---|
| Segment H: share of firms | 80% | 20% |
| Segment H: AI-use rate | 70% | 80% |
| Segment L: share of firms | 20% | 80% |
| Segment L: AI-use rate | 20% | 30% |
The aggregate rate in A is 60%: 80% × 70% + 20% × 20%. In B it is 40%: 20% × 80% + 80% × 30%. Yet B has the higher use rate within both segments.
Apply an illustrative common mix of 50% H and 50% L. A becomes 45%, and B becomes 55%. The ranking reverses without changing either market's segment-specific rates.
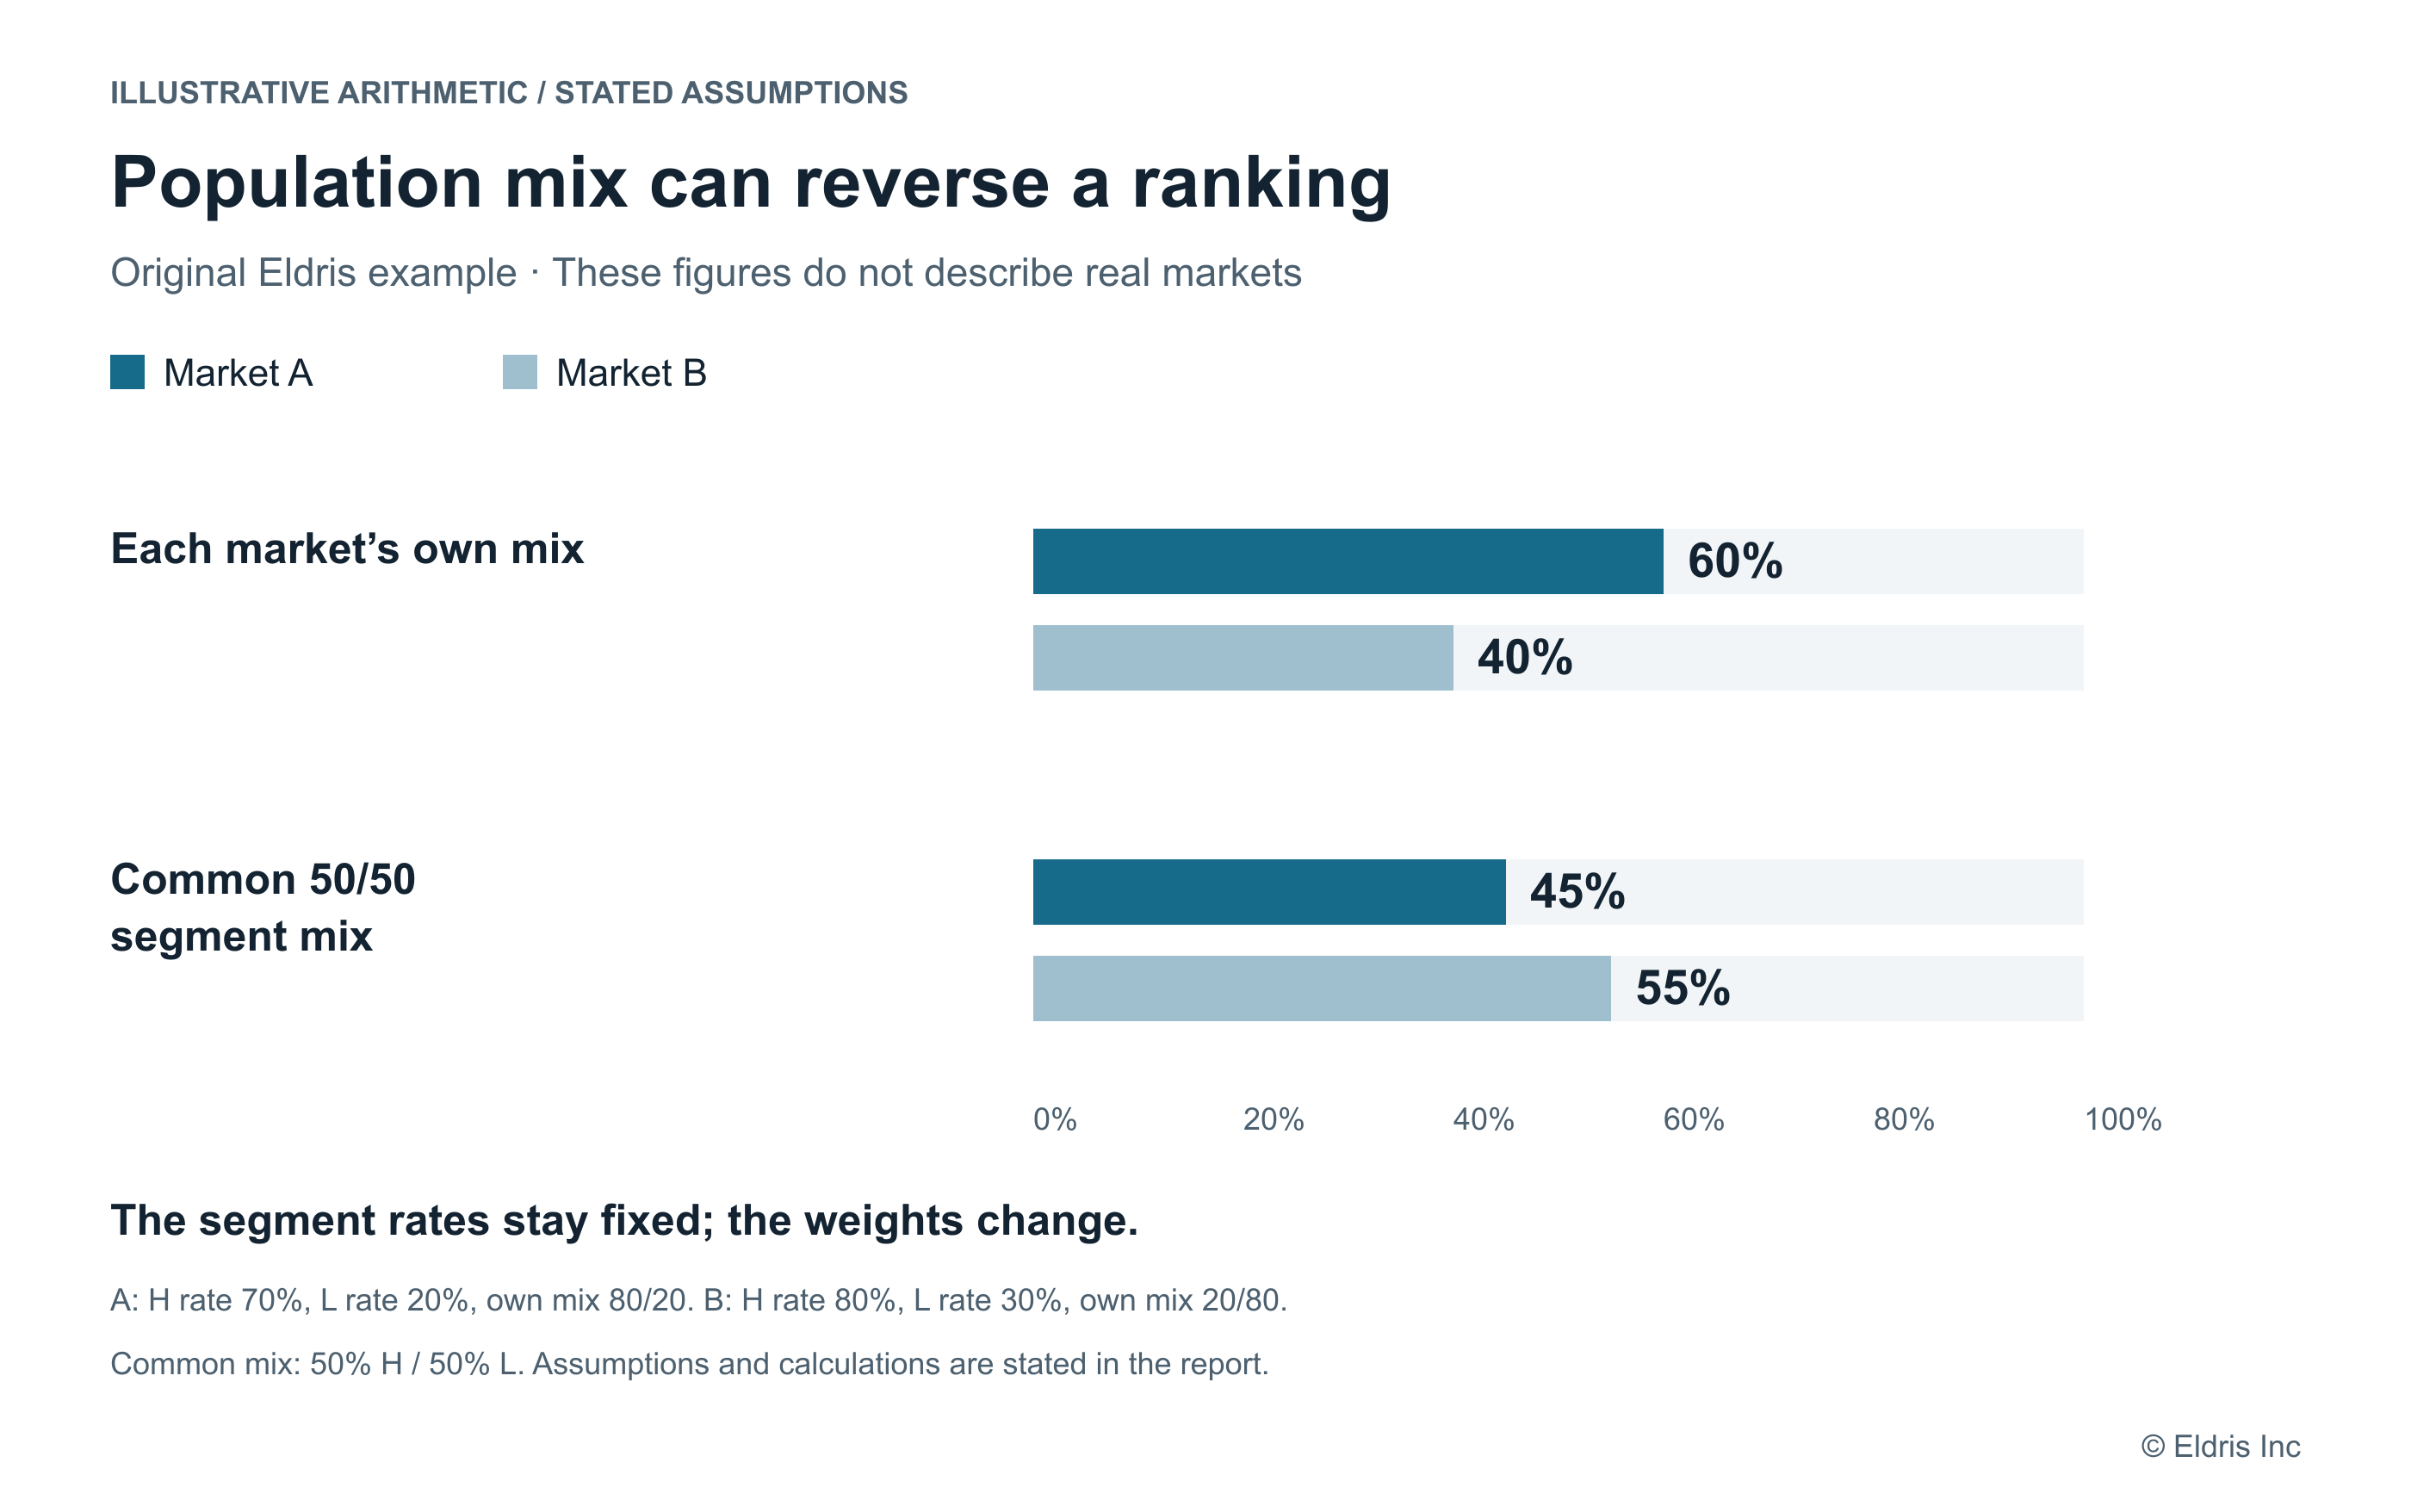
Figure 2. A population difference can reverse the headline ranking. Original Eldris arithmetic example using the assumptions above. The common mix is illustrative, not an estimate of a real target population. No uncertainty interval or market prediction is implied.
The practical question is which comparison serves the decision. If a provider is choosing between the whole markets as they actually exist, their composition may be commercially important. If it is comparing demand within a particular customer segment, the aggregate ranking can obscure the relevant result.
Standardization is therefore not a way to declare one market the true winner. It answers a different question: what would the rates be under a specified common composition, assuming the segment rates apply?
In actual research, use a defensible target mix, comparable measurements and adequate segment data. Show both the original and adjusted results. If the ranking changes across plausible mixes, treat the decision as sensitive to composition rather than presenting one definitive order.
Decision implication: Before labeling a market or unit behind its peers, examine the relevant groups. Do not turn an aggregate difference into a claim about culture, leadership or capability without further evidence.
A geography label is not an operating model
Eurostat's 2025 headline reports AI use by 20.0% of EU enterprises within the survey's coverage. Its methodological notes specify enterprises with at least 10 employees or self-employed persons and selected economic activities. This is not a rate for every EU business. Eurostat release and coverage notes.
The OECD SME survey covered firms with up to 249 employees, including one-person firms, across Austria, Canada, Germany, Ireland, Japan, Korea and the United Kingdom. Its fieldwork ran from October 14 through December 6, 2024. OECD survey methodology.
The population boundaries alone prevent treating these headlines as a matched comparison of AI readiness. Differences in technology definitions, timing and reporting add further questions. A regional label does not make a source a substitute for evidence about a particular buyer population.
For multinational rollout planning, specify the receiving setting. A process tested in a headquarters team may encounter different languages, source records, access rights, case complexity, approval practices and support capacity elsewhere. The relevant issue is whether those differences could change the accepted outcome, cost or authorization decision.
Likewise, a global rate of AI interest cannot settle a U.S. market-entry choice for a specific provider. Define the buyer, task, deployment arrangement and assurance requirements. If model origin, hosting location and provider familiarity may affect acceptance, investigate them separately. A country-level adoption figure cannot identify which condition changes purchasing approval.
These are factors to test, not established explanations of national differences. Avoid using nationality as a shortcut for behavior when the operative difference may be the workflow or the offer.
Decision implication: Describe the target operating conditions before importing a benchmark. Transfer the question and method where useful; verify the answer in the receiving setting.
Measurement changes can look like market movement
The U.S. Census Bureau changed its BTOS core AI questions beginning November 17, 2025. The current-use question broadened from use in producing goods or services to use in any business function. Following an observed level shift, Census established a new series beginning with the December 4, 2025 release. Census question-update documentation.
That is a documented change in the instrument. A comparison across the break must not attribute the entire difference to changed business behavior. The evidence does not supply a universal correction factor for every firm or industry.
Keep three dates distinct: when responses were collected, the period respondents were asked to describe, and when the findings were published. A recently published report can describe older activity. A stated intention for the next six months is also a different outcome from use during the preceding two weeks.
Inside a company, a definition can change when a new dashboard counts embedded features, when tool access expands, or when the organization begins recording previously invisible activity. Annotate these changes before interpreting a trend. Preserve prior definitions where possible and use an overlap period when a bridge is needed and feasible.
Tool versions and deployment arrangements also matter when transferring an outcome estimate. If the proposed system has different capabilities, information access or review requirements, a previous result should be tested under the new conditions. A newer tool name does not prove a larger benefit.
Decision implication: Require a measurement-change record alongside trend charts. When comparability breaks, show the break instead of producing a continuous growth story.
What adjustment can and cannot repair
Reweighting changes the contribution of observed groups to an estimate. It can help when the source measures the same outcome and includes sufficiently comparable groups with reliable data. It does not create observations for people, firms or workflows that were not studied.
Before adjusting a source, establish:
- A defined target. Identify whose rate or outcome the business needs to estimate.
- A common measure. Confirm that the source and target refer to the same behavior, authority and period.
- Relevant group information. Use characteristics that could affect the result and that are measured comparably.
- Coverage and precision. Determine whether the source contains the target groups with enough evidence to support an estimate.
- A defensible transfer assumption. State why outcomes within those groups are expected to apply to the target setting, and what could invalidate that expectation.
Matching firm size and industry does not establish equal task relevance, purchasing rules or system performance. Weighting can make a sample look more like a target on observed characteristics while leaving these differences unresolved.
Do not convert willingness into completed purchases, occasional use into continuing reliance, or perceived productivity into realized profit by attaching an adjustment factor. Those are different outcomes requiring different evidence.
A larger dataset is not automatically a better match. Nor does generating synthetic observations resolve a missing population, an incompatible definition or an untested operating condition. Any modeled extension inherits assumptions; it should be evaluated separately from observed evidence.
When source data cannot support a credible adjustment, the useful output is a bounded statement of what the source establishes and a plan for acquiring the missing evidence. Precision in presentation should not exceed precision in the underlying comparison.
Decision implication: Use adjustment to answer a specified statistical question. Use local evidence to test whether the business conditions support applying the result.
Give each benchmark a declared role
The following framework is original Eldris guidance for reviewing evidence. These are roles a benchmark may serve, not scores to add together or a validated prediction of decision quality.
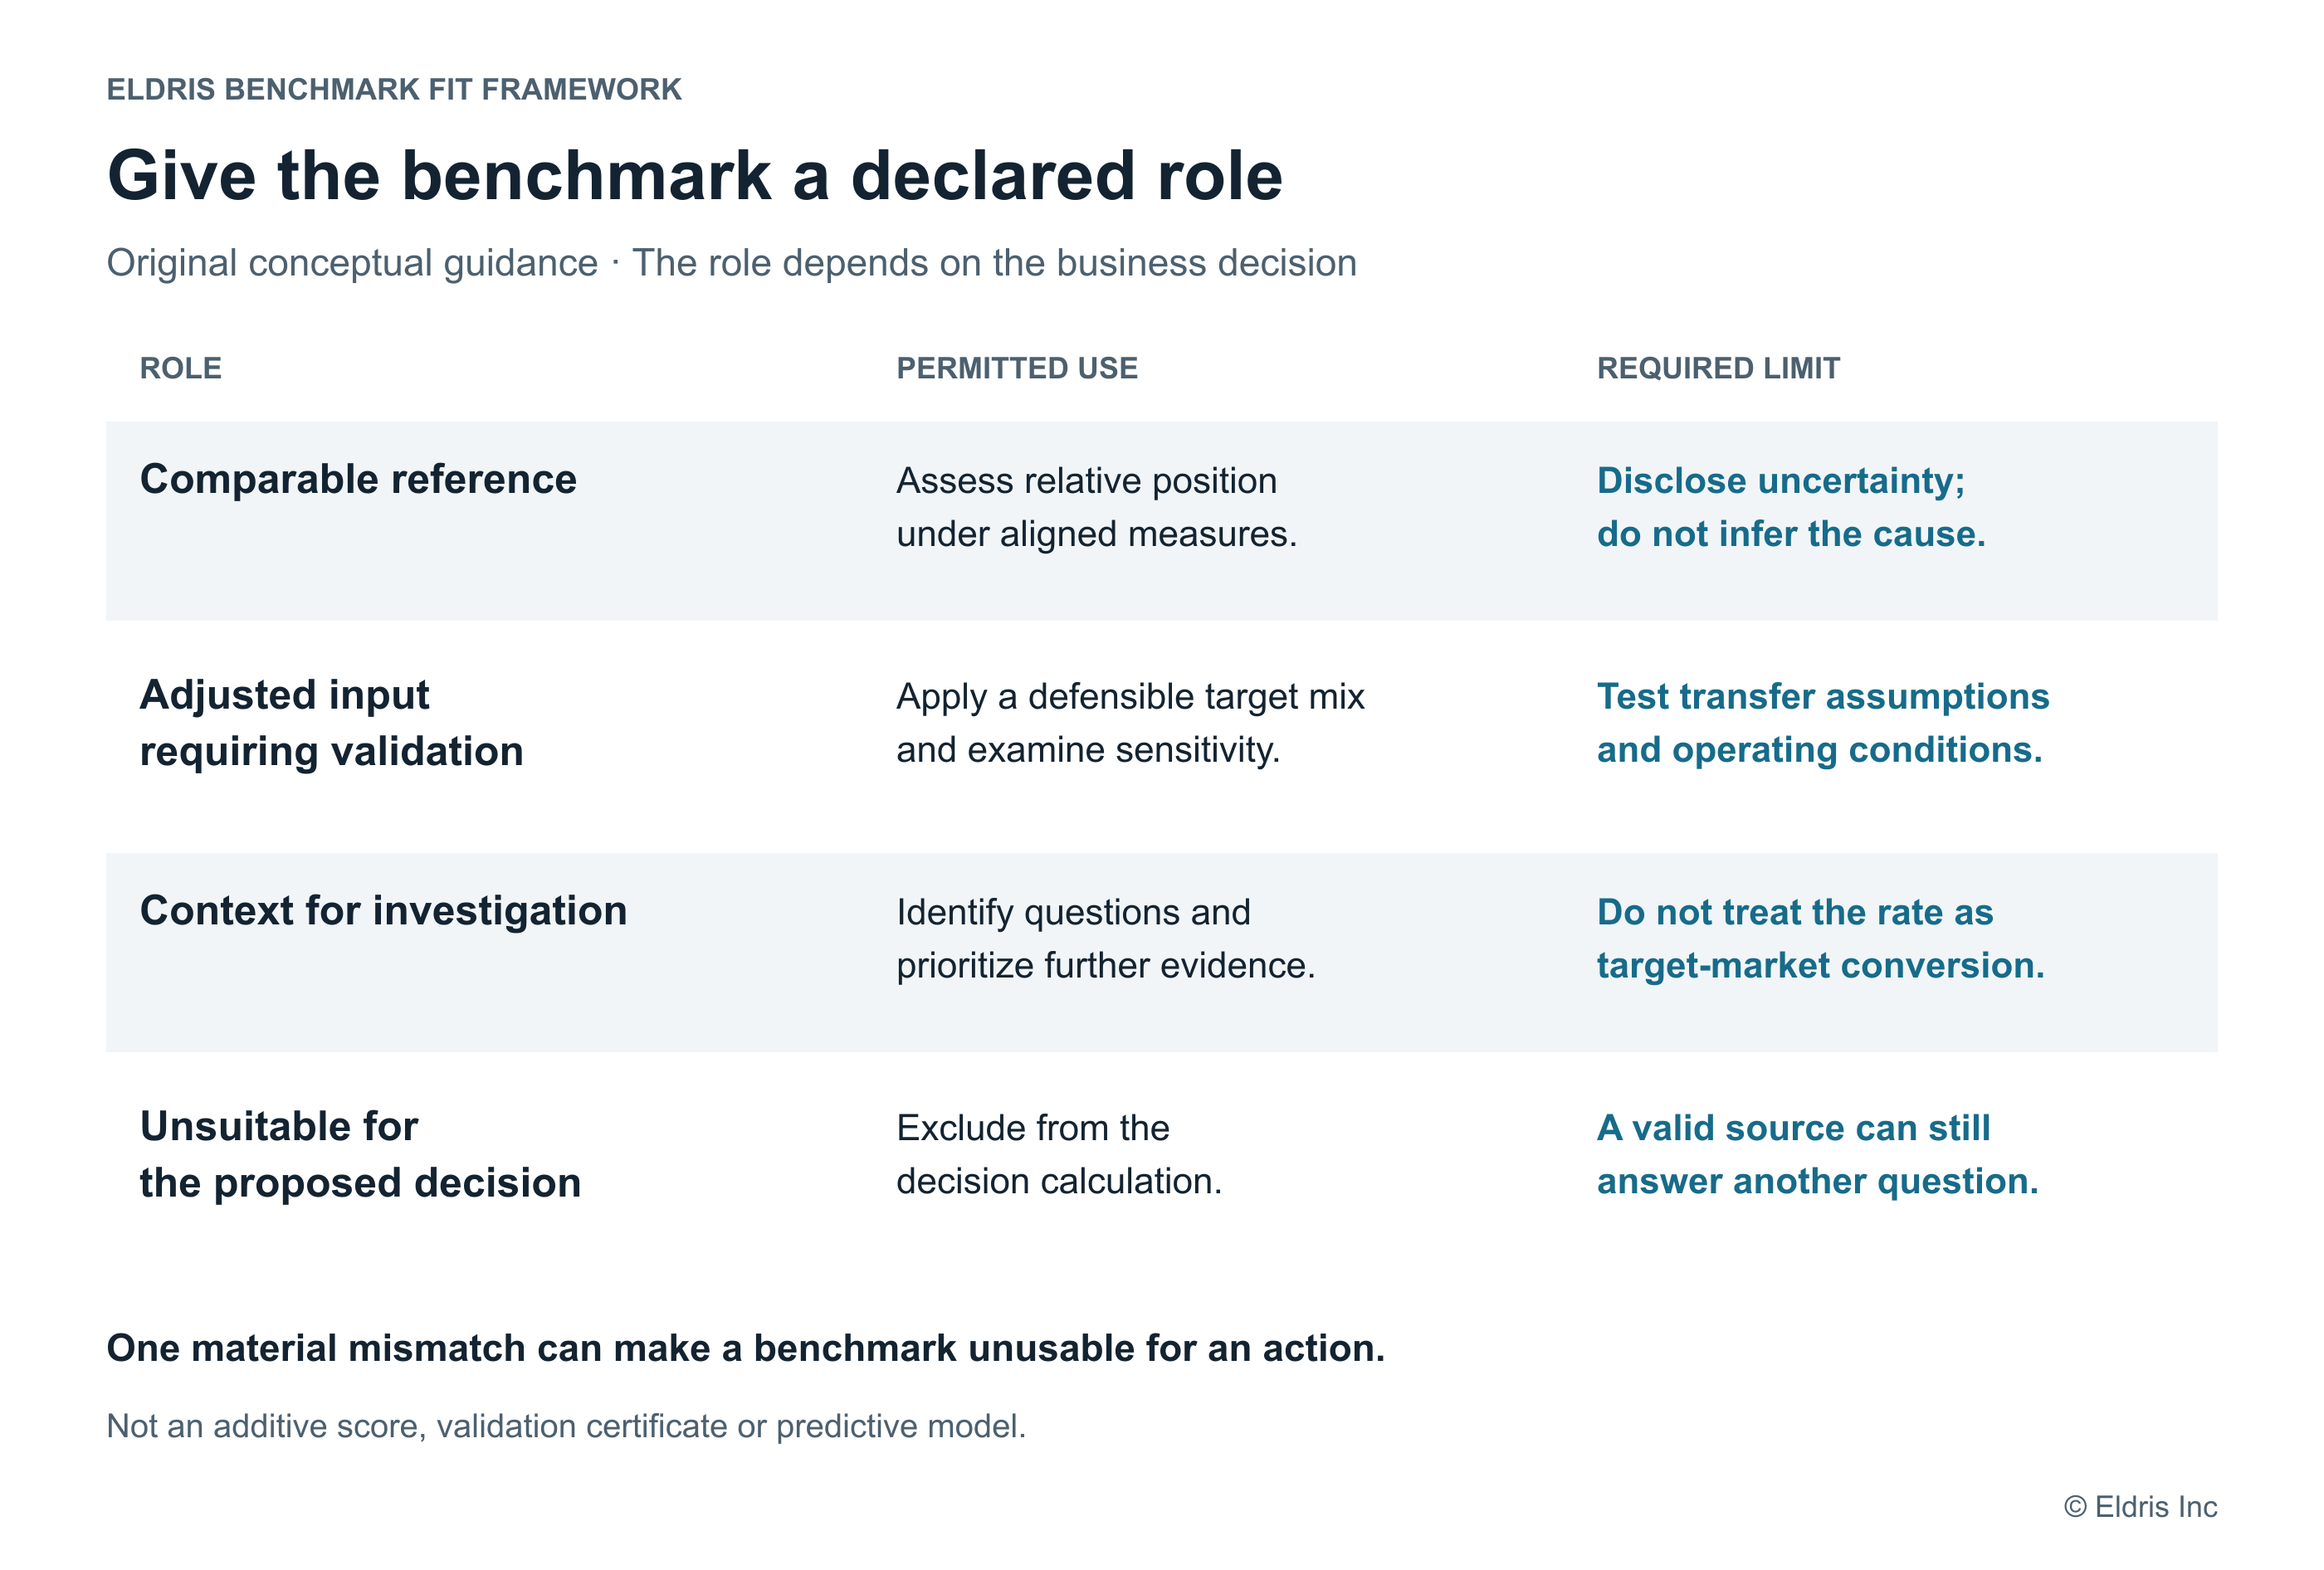
Figure 3. Decide how the evidence may be used. A source can be useful for background and unsuitable for forecasting. A major mismatch should not be hidden by averaging it with several minor matches.
Comparable reference. The unit, measure, period and relevant population align sufficiently for the declared comparison. Use it to assess relative position, with uncertainty and remaining limits disclosed. Similarity does not establish the cause of a gap or justify copying another organization's strategy.
Adjusted input requiring validation. The measure aligns, but observable population differences need an explicit adjustment. Present the target mix, assumptions and sensitivity. Verify operating conditions before turning the adjusted input into a deployment or market recommendation.
Context for investigation. The source establishes that a behavior or concern exists in another setting. Use it to choose questions, identify plausible segments or prioritize research. Do not enter its headline rate into the revenue model as if it were a target-market conversion estimate.
Unsuitable for the proposed decision. The source measures a different outcome, lacks the necessary population, or leaves a material mismatch unresolved. Exclude it from that decision calculation. It can remain a valid source for the question it actually answers.
Apply these roles to the action being considered. A small-business survey may inform a broad ecosystem brief while contributing little to approval of an assistant in a regulated multinational workflow. The source's role changes because the decision changes.
Decision implication: Put the permitted use and the material limitation beside the benchmark. Readers should not need to recover them from a distant footnote.
What to require before the next decision
For a market-entry decision, estimate the defined buyer population separately from willingness, approval, purchase and continued use. Require evidence about the proposed product and commercial terms. State which quantities are observed, modeled or still unknown.
For a rollout target, define eligible tasks and the outcome that justifies expansion. Compare units on relevant opportunities and operating conditions. A justified target may differ by workflow; a common definition is more useful than an identical rate for all teams.
For a competitive comparison, distinguish evidence of activity from evidence of operational capability. A peer's reported use can justify investigation. It does not reveal its reliability, costs, controls or return without additional evidence.
For every material benchmark, request a short decision record:
- The action under consideration and the outcome that matters.
- The source population, unit, measure and measurement period.
- The receiving population and operating conditions.
- Material matches and mismatches, with uncertainty identified.
- Any adjustment, its assumptions and sensitivity to plausible alternatives.
- The benchmark's declared role and the evidence still needed before acting.
If plausible assumptions reverse the recommendation, identify the next measurement that would resolve the choice. This might be a matched buyer study, a limited deployment in the receiving workflow, or better segment counts. Collect evidence for the unresolved decision rather than commissioning another undifferentiated adoption survey.
The central recommendation is to make every borrowed number carry an explicit account of why it belongs in this decision. A benchmark earns influence through that fit, not through the prominence of the source or the size of its headline percentage.
Method and limitations
This brief selectively reviews primary public sources checked on October 3, 2026. It is not a systematic review, original participant study, pooled estimate or reanalysis of source microdata. The published figures retain their original populations and purposes.
The OECD firm and employment shares are related descriptions of one study, not a comparison of firm behavior against individual employee behavior. The Eurostat figure is labeled by reference year and coverage; it is not presented as a current estimate for all European businesses. The Census example documents a change in question wording and series treatment rather than estimating how much of a trend reflects behavior.
The market-ranking example is original arithmetic under stated assumptions. Its segment rates, population mixes and market labels are illustrative and do not describe observed populations. It demonstrates a possible aggregation effect; it does not establish how often such reversals occur in AI research.
The fit assessment, benchmark roles and recommendations are Eldris interpretations. An adjusted estimate would need source data, a defensible target population and an appropriate uncertainty analysis. No new adjusted market estimate, synthetic participant dataset or validated predictive framework is presented.
Sources
- OECD. Generative AI and the SME Workforce: New Survey Evidence. Chapter 2, How are SMEs using generative AI? Published November 5, 2025. The reported 30.7% firm share and 38.4% employment coverage appear in the findings and note 1. Findings and notes.
- OECD. Generative AI and the SME Workforce. Chapter 1, Introduction: Survey methodology. Survey of 5,232 SMEs in seven countries; main fieldwork October 14-December 6, 2024. Defines coverage, respondent selection, sampling and firm-based weighting. Methodology.
- Eurostat. 20% of EU enterprises use AI technologies. Published December 11, 2025; reference year 2025. Minimum size: 10 employees or self-employed persons; covered activities: NACE Rev. 2 sections C-J, L-N and group 95.1. Release and coverage notes.
- U.S. Census Bureau. BTOS AI Core Question Updates. Dated December 3, 2025. Documents revised wording from November 17, 2025, and a new series beginning with the December 4, 2025 data release. Technical documentation.